Picture Graph
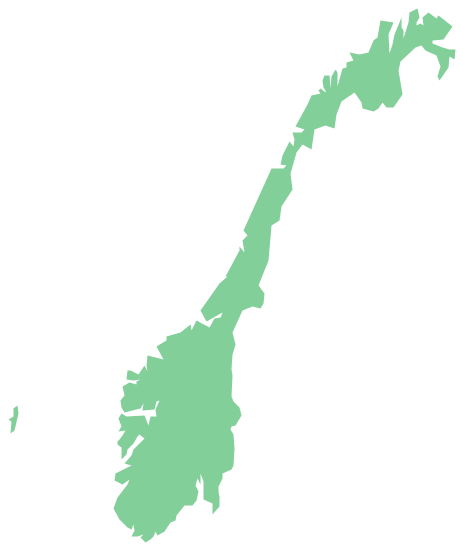
A Picture Graph is a popular and widely used type of a bar graph, which represents data in various categories using the pictures. ConceptDraw PRO extended with Picture Graphs solution from the Graphs and Charts area of ConceptDraw Solution Park is the best software for fast and simple drawing professional looking Picture Graphs.Geo Map - Europe - Norway
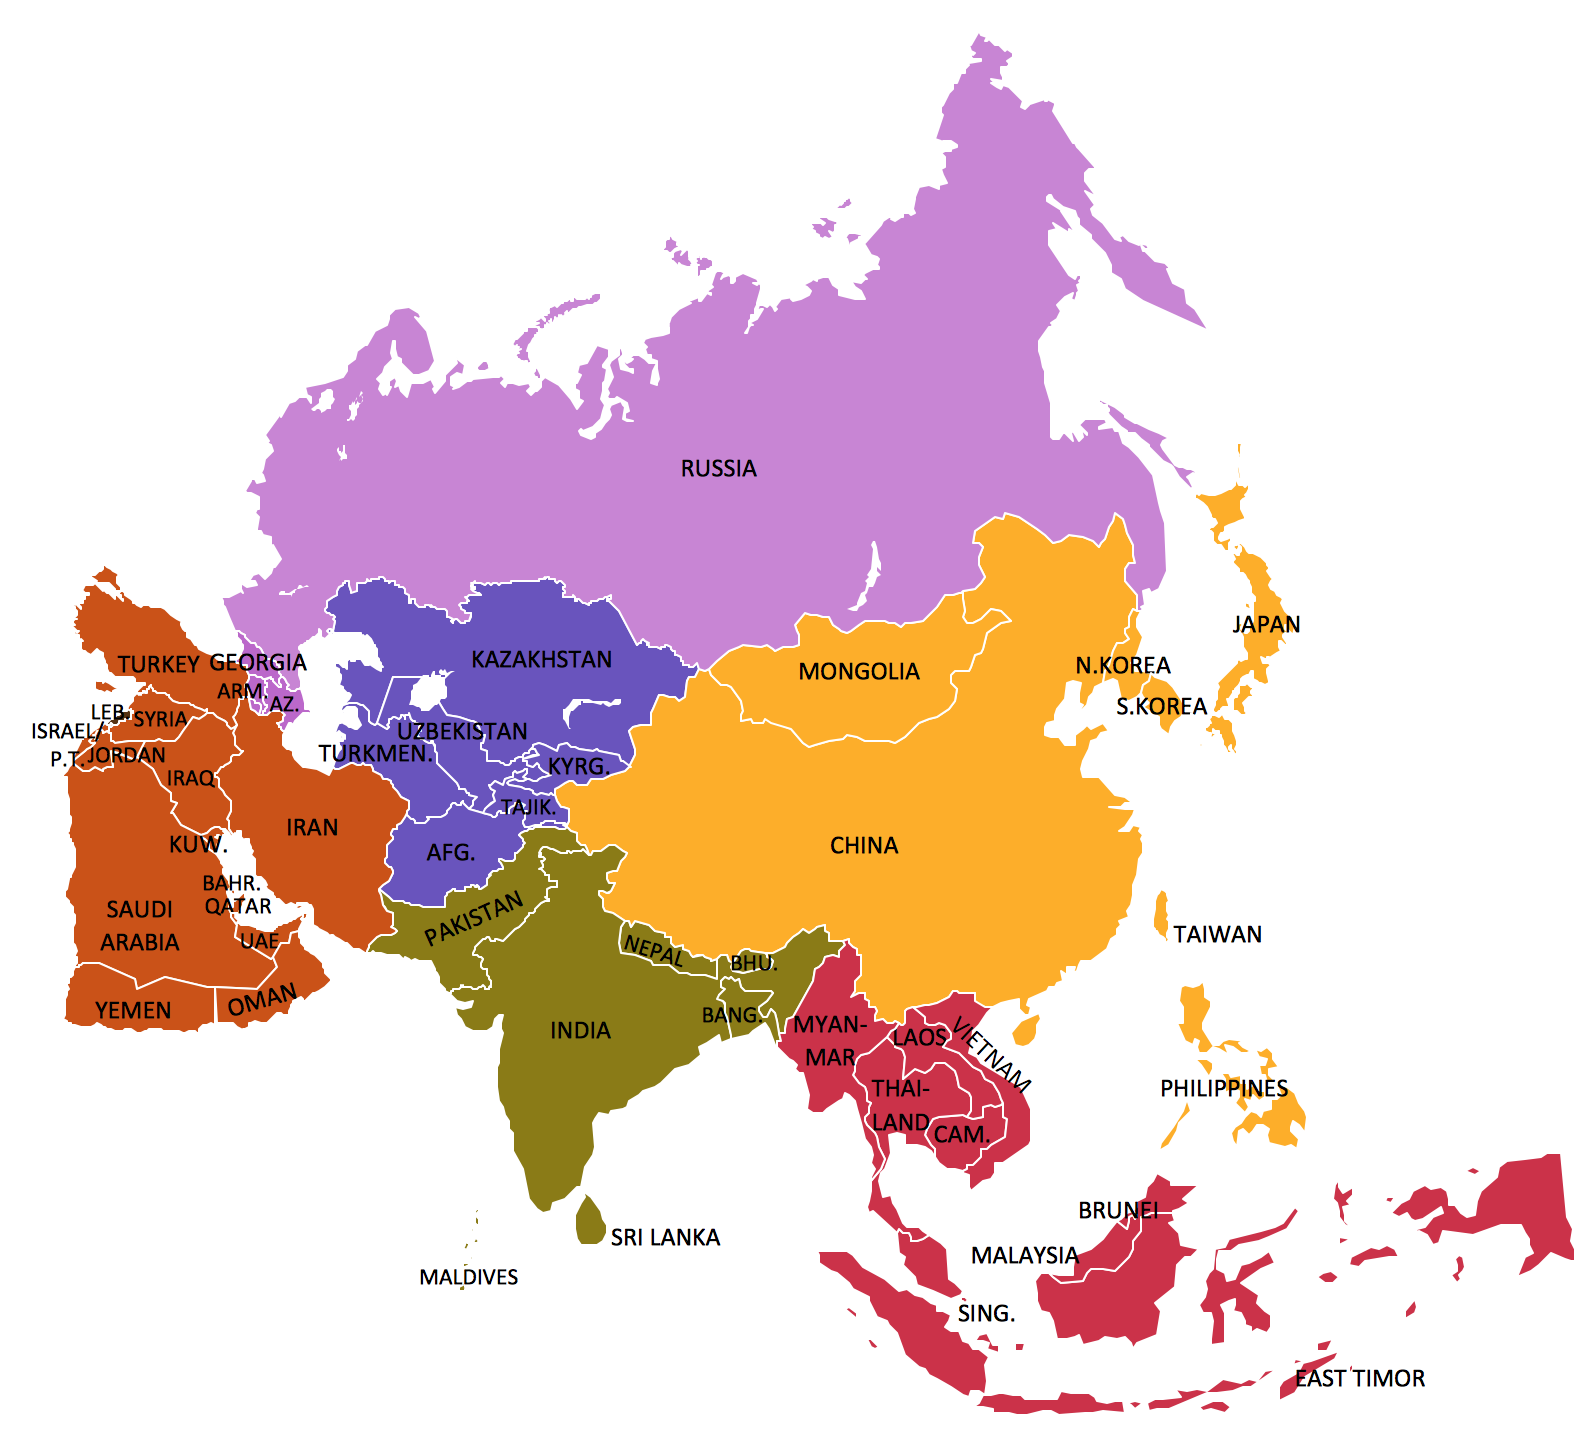
The vector stencils library Norway contains contours for ConceptDraw PRO diagramming and vector drawing software. This library is contained in the Continent Maps solution from Maps area of ConceptDraw Solution Park.Geo Map — Asia
ConceptDraw is idea to draw the geological maps of Asia from the pre-designed vector geo map shapes. Use Geo Map Asia to draw thematic maps, geospatial infographics and vector illustrations for your business documents, presentations and websites.Pictures of Graphs
ConceptDraw PRO diagramming and vector drawing software extended with Picture Graphs solution from the Graphs and Charts Area is the best choice for making professional looking pictures of graphs and colorful picture graphs.How to Draw a Line Graph
In your work activity you need regularly draw the line graphs? And each time you ask yourself a question "How to Draw a Line Graph easier and faster?". The desire to automate the line graphs drawing process led to the creation of Line Graphs solution from Graphs and Charts area of ConceptDraw Solution Park.
 Picture Graphs
Typically, a Picture Graph has very broad usage. They many times used successfully in marketing, management, and manufacturing. The Picture Graphs Solution extends the capabilities of ConceptDraw PRO v10 with templates, samples, and a library of professionally developed vector stencils for designing Picture Graphs.
Basic Diagramming
Create flowcharts, organizational charts, bar charts, line graphs, and more with ConceptDraw PRO.
Simple Diagramming
Create flowcharts, org charts, floor plans, business diagrams and more with ConceptDraw PRO.
Process Flowchart
The main reason of using Process Flowchart or PFD is to show relations between major parts of the system. Process Flowcharts are used in process engineering and chemical industry where there is a requirement of depicting relationships between major components only and not include minor parts. Process Flowcharts for single unit or multiple units differ in their structure and implementation. ConceptDraw PRO is Professional business process mapping software for making Process flowcharts, Process flow diagram, Workflow diagram, flowcharts and technical illustrations for business documents and also comprehensive visio for mac application. Easier define and document basic work and data flows, financial, production and quality management processes to increase efficiency of your business with ConcepDraw PRO. Business process mapping software with Flowchart Maker ConceptDraw PRO includes extensive drawing tools, rich examples and templates, process flowchart symbols and shape libraries, smart connectors that allow you create the flowcharts of complex processes, process flow diagrams, procedures and information exchange. Process Flowchart Solution is project management workflow tools which is part ConceptDraw Project marketing project management software. Drawing charts, diagrams, and network layouts has long been the monopoly of Microsoft Visio, making Mac users to struggle when needing such visio alternative like visio for mac, it requires only to view features, make a minor edit to, or print a diagram or chart. Thankfully to MS Visio alternative like ConceptDraw PRO software, this is cross-platform charting and business process management tool, now visio alternative for making sort of visio diagram is not a problem anymore however many people still name it business process visio tools.
The Best Flowchart Software Available
ConceptDraw gives the ability to draw Flowchart documents. Flowcharts solutionis a powerful tool that extends ConceptDraw application for drawing business flowcharts. ConceptDraw PRO vector diagramming and business graphics software enhanced with with templates, green and interactive flowchart makers, samples and stencil libraries from ConceptDraw Solution Park which all focused to help with drawing flowcharts, block diagrams, bar charts, histograms, pie charts, divided bar diagrams, line graphs, area charts, scatter plots, circular arrows diagrams, Venn diagrams, bubble diagrams, concept maps, and others.
Bar Charts
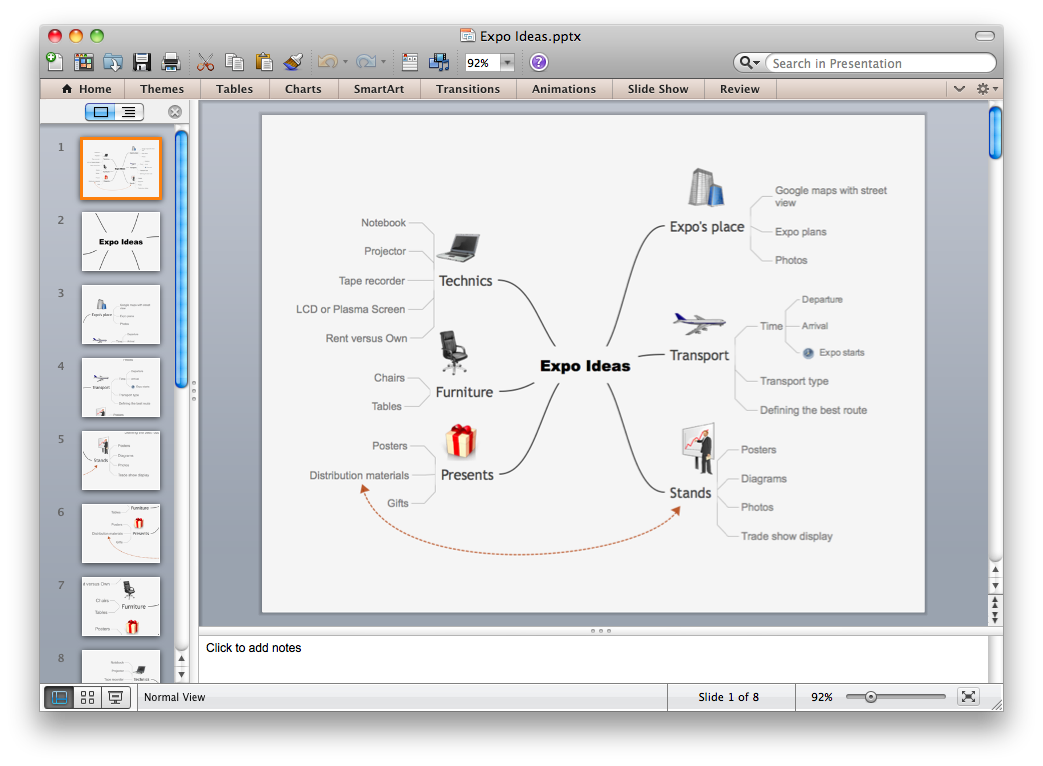
ConceptDraw PRO diagramming and vector drawing software extended with Bar Graphs solution from the Graphs and Charts area of ConceptDraw Solution Park is ideal for drawing the Bar Charts fast and simply.Export from ConceptDraw MINDMAP to PowerPoint® Presentation
ConceptDraw MINDMAP extended with Presentation Exchange solution allows you to create a traditional PowerPoint Presentation from your mind maps.
to MS PowerPoint
Competitor Analysis
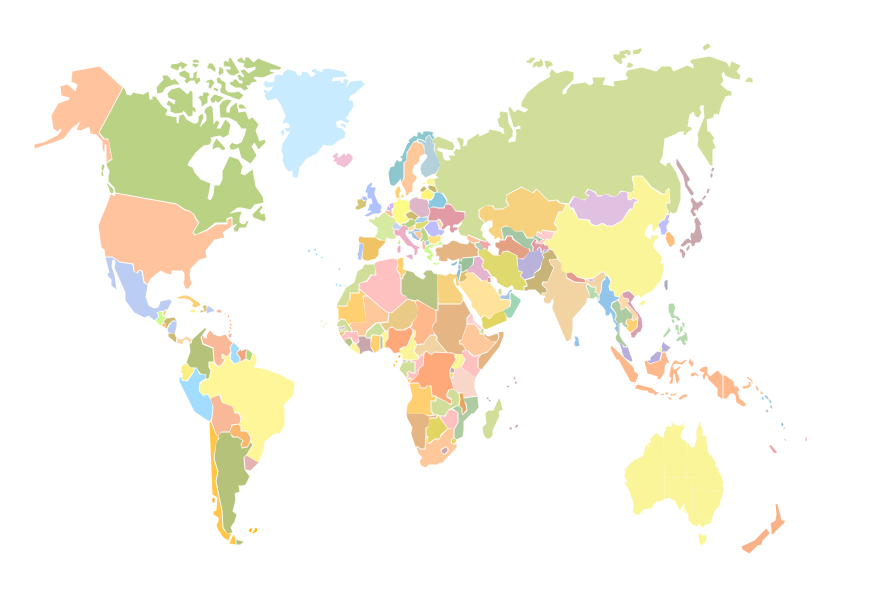
Competitor analysis is a first and obligatory step in elaboration the proper corporate marketing strategy and creating sustainable competitive advantage. Use powerful opportunities of numerous solutions from ConceptDraw Solution Park for designing illustrative diagrams, charts, matrices which are necessary for effective competitor analysis.Geo Mapping Software Examples - World Map Outline
An Example world map, showing a simple outline of world map. The world map is vector and can be edited or export to svg format.Best Mind Mapping Program for Making Presentations
ConceptDraw MINDMAP with the ability to import presentations from Microsoft PowerPoint, as well as enhancing its existing presentation capabilities.- Picture Graphs | Pictures of Graphs | Area Charts | Population ...
- Picture Graph | Bar Diagrams for Problem Solving. Create space ...
- Picture Graph | Pictures of Graphs | Geo Map - Asia | Graph ...
- Pictures of Graphs
- Bar Graph On Area Of Seven Continent
- What are Infographic Area | Pictures of Graphs | Geo Map - Asia ...
- Geo Map - Asia | Pictures of Graphs | Picture Graph | World ...
- Picture Graph | Pictures of Graphs | Geo Map - Asia | World ...
- Picture Graphs | Infographic Maker | Geo Map - Oceania | Population ...
- Pictures of Graphs | Basic Diagramming | Geo Map - Europe ...
- Pictures of Graphs | Geo Map - Asia | What Is a Line Chart | Graph Of ...
- Picture Graph | How to Draw a Line Graph | Geo Mapping Software ...
- Picture Graph | Bar Diagrams for Problem Solving. Create space ...
- Infographic Maker | Geo Map - Oceania | Picture Graphs | Draw ...
- Pictures of Graphs | Basic Diagramming | Geo Map - Asia ...
- Regional population growth from 2010 to 2016 | Picture Graph ...
- Bar Chart Examples | Bar Graphs | Pictures of Graphs | Bar Grapgh ...
- Bar Graph On Area Of 7 Continent
- Concept Maps | Education | What are Infographic Area | Vector ...

