HelpDesk
How to Create a Custom Library
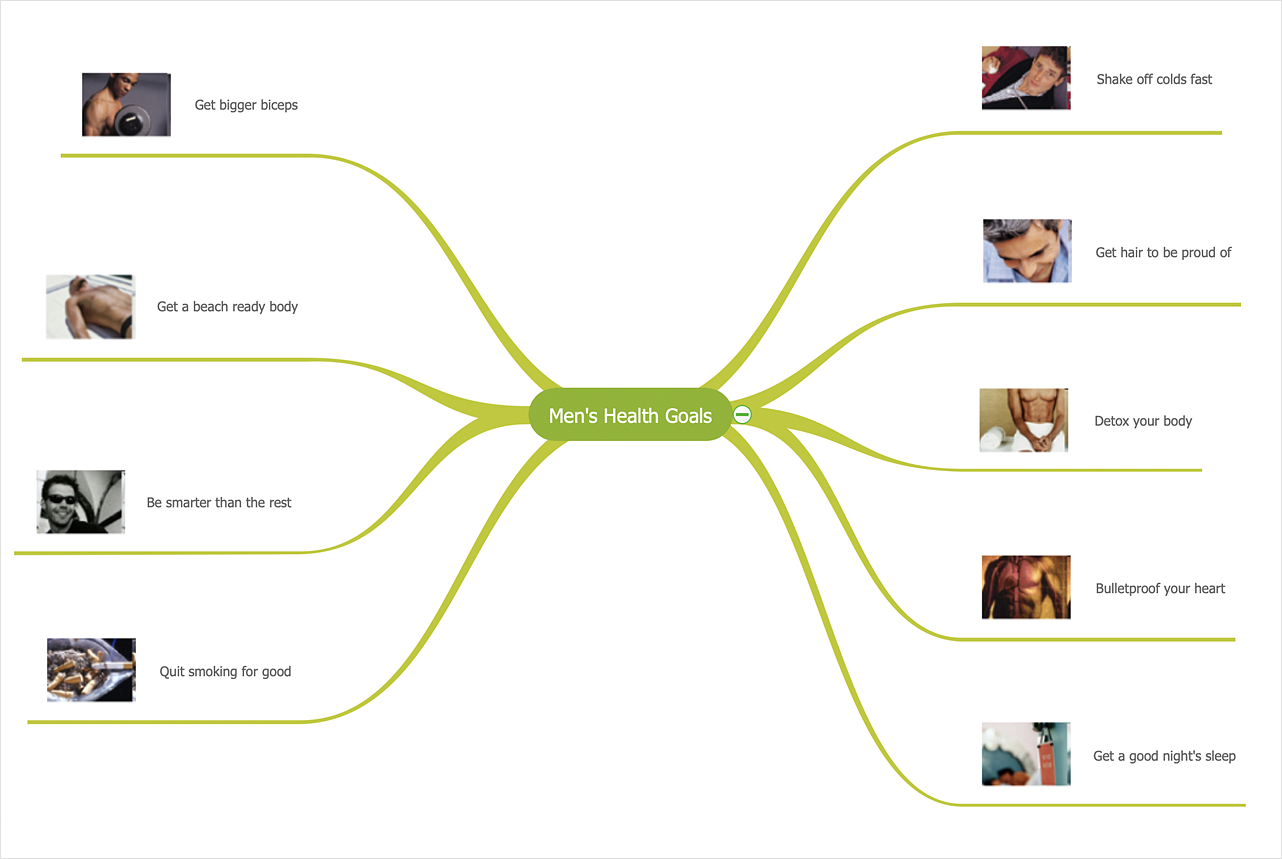
Why do people use custom clip art to create their mind maps? First, this allows you to create your author's style. Making a mind map is a creative work, and each mind map depicts the personality of its author. More, the custom clip art is needed if your mind map often contains the same set of custom images that are not supplied with the standard software package. ConceptDraw MINDMAP allows you to create a custom clip art library to increase the visual capacity of your mind maps. You can even deploy them inside ConceptDraw MINDMAP so that you can use them through standard interface tools.
 Value Stream Mapping
Value stream mapping solution extends ConceptDraw DIAGRAM software with templates, samples and vector stencils for drawing the Value Stream Maps (VSM) in lean manufacturing practice.
Geo Map - USA - New Jersey
New Jersey is a state in the Northeastern and Middle Atlantic regions of the United States. The vector stencils library New Jersey contains contours for ConceptDraw DIAGRAM diagramming and vector drawing software. This library is contained in the Continent Maps solution from Maps area of ConceptDraw Solution Park.
 Business Process Workflow Diagrams
The Business Process Workflow Diagrams solution enhances the ConceptDraw DIAGRAM functionality with predesigned examples, samples and a numerous collection of predesigned vector objects of workflow chart elements, icons, arrows, connectors, and varied wor
Basic Flowchart Symbols and Meaning
Flowcharts are the best for visually representation the business processes and the flow of a custom-order process through various departments within an organization. ConceptDraw DIAGRAM diagramming and vector drawing software extended with Flowcharts solution offers the full set of predesigned basic flowchart symbols which are gathered at two libraries: Flowchart and Flowcharts Rapid Draw. Among them are: process, terminator, decision, data, document, display, manual loop, and many other specific symbols. The meaning for each symbol offered by ConceptDraw gives the presentation about their proposed use in professional Flowcharts for business and technical processes, software algorithms, well-developed structures of web sites, Workflow diagrams, Process flow diagram and correlation in developing on-line instructional projects or business process system. Use of ready flow chart symbols in diagrams is incredibly useful - you need simply drag desired from the libraries to your document and arrange them in required order. There are a few serious alternatives to Visio for Mac, one of them is ConceptDraw DIAGRAM. It is one of the main contender with the most similar features and capabilities.
 HR Flowcharts
Human resource management diagrams show recruitment models, the hiring process and human resource development of human resources.
HelpDesk
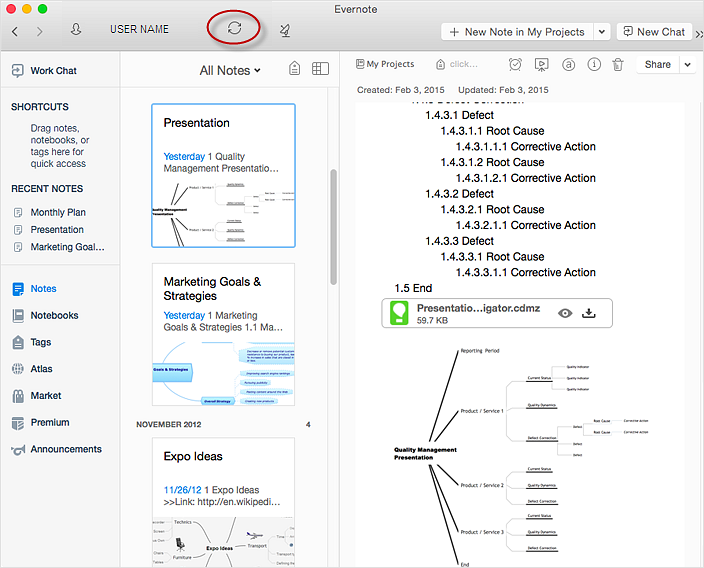
How to Send a Mind Map File to Evernote
The Note Exchange solution lets you to send a document, created with ConceptDraw MINDMAP to your Evernote account.
 Continent Maps
Continent Maps solution extends ConceptDraw DIAGRAM software with templates, samples and libraries of vector stencils for drawing the thematic maps of continents, state maps of USA and Australia.
Entity Relationship Diagram Symbols
The semantic modeling method nowadays is successfully applied in database structure design. It is effective method of modeling the data structures, which is based on the meaning of these data. As a tool of semantic modeling, there are used different types of Entity-Relationship Diagrams. Entity Relationship Diagram (ERD) is applied to visually and clearly represent a structure of a business database. The main components of ERDs are: entity, relation and attributes. An entity is a class of similar objects in the model, each entity is depicted in the form of rectangle and has the name expressed by a noun. Relation is shown in the form of non-directional line that connects two entities. There are several notation styles used for ERDs: information engineering style, Chen style, Bachman style, Martin Style. The Entity Relationship Diagram symbols used for professional ERD drawing are predesigned by professionals and collected in the libraries of the Entity-Relationship Diagram (ERD) solution for ConceptDraw DIAGRAM software.- Magnet Cartoon Png
- Application - Vector stencils library | Exam Preparation Mind Map ...
- Network - Vector stencils library | Forbidden Png
- Open Book Image Png
- Europe Vector Png
- Vector Characters Png
- How to Add a Mind Map into a Given Notebook in Your Evernote ...
- Dna Vector Png
- Air Plane Png
- Pencil Stencil Png


