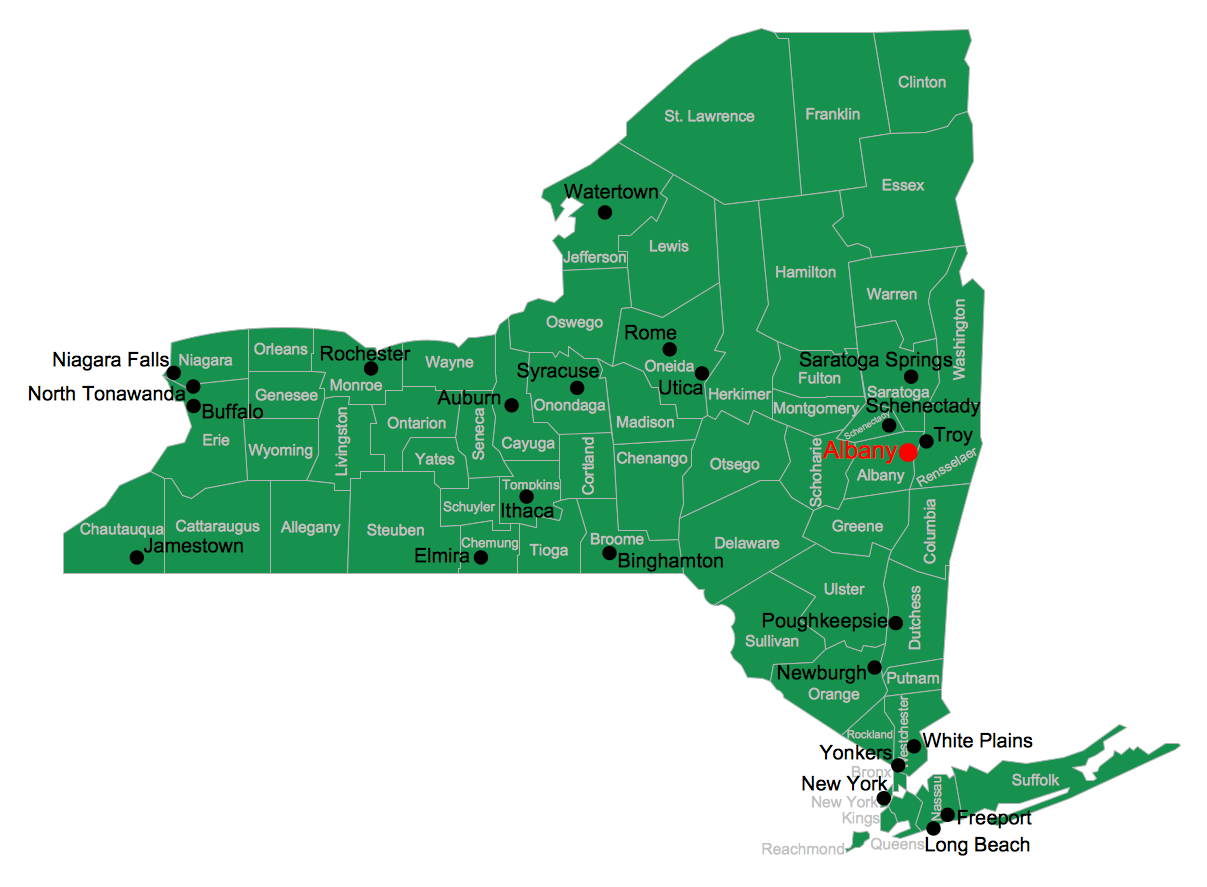
This site uses cookies. By continuing to browse the ConceptDraw site you are agreeing to our Use of Site Cookies.

USA Map

Usually designing of maps, including the USA Map is a quite complex, long and labour-intensive process. But now we have an excellent possibility to make it easier with ConceptDraw DIAGRAM diagramming and vector drawing software extended with powerful USA Maps Solution from the Maps Area of ConceptDraw Solution Park.
HelpDesk

How to Draw a Map of USA States

You can find a huge set of geopolitical statistical data regarding America. A common way of visualizing this data is to create maps that connect a particular data in relation to a specific geographical area. Thematic maps are used to depict such data as population density, average rainfall, or political allegiance, representing the data by using visual elements and annotation. Thematic maps always focus on one particular subject matter unlike general reference maps, which display information on different subjects — vegetation, topology, roads, and highways, etc.
The United States Mapping Solution for ConceptDraw DIAGRAM includes all of the US States with county outlined borders, from the largest, San Bernardino in California, to the smallest Kalawao County, Hawaii.
HelpDesk

How to Draw Maps of Australia

Australia is the sixth largest country in the world. Australia consists from the mainland which is surrounded by many thousands of small fringing islands and numerous larger ones. The vast territories, aligned with interesting historic features across a wide expanse, make the thematic map an ideal way of depicting geographical, geological and political information related to Australia. The Australia Map solution for ConceptDraw DIAGRAM will help you to make the steps of the creativeness easy and intuitive. The Australia Map solution provides templates and samples along with vector stencils to get you started. Used together with other ConceptDraw DIAGRAM solutions it will allow you to create comprehensive geography-related infographics.

map of germany, germany map, vector map, maps of germany, map of germany with cities Germany Map

map of germany, germany map, vector map, maps of germany, map of germany with cities
The Germany Map solution contains collection of samples, templates and scalable vector stencil graphic maps, representing map of Germany and all 16 states of Germany. Use the Germany Map solution from ConceptDraw Solution Park as the base for various them
HelpDesk

How to Create a Map of Germany

Geographical thematic maps are used to display information on a variety of subjects. It is a common way of representing any form of spatial data in relation to a specific geographical area. The Germany Map Solution for ConceptDraw DIAGRAM includes all of the German federal states with county outlined borders and major cities. You can quickly create geographic maps, cartograms, and thematic maps for geographical visualization information for business and travels.

Maps of Germany

Germany is a federal parliamentary republic in West-Central Europe which consists of 16 constituent states. It is a part of Schengen area and the most populous member state in the European Union. ConceptDraw DIAGRAM diagramming and vector drawing software offers the unique Germany Map Solution from the Maps Area of ConceptDraw Solution Park, developed specially for easy drawing the maps of Germany of different levels of complexity and detailing.

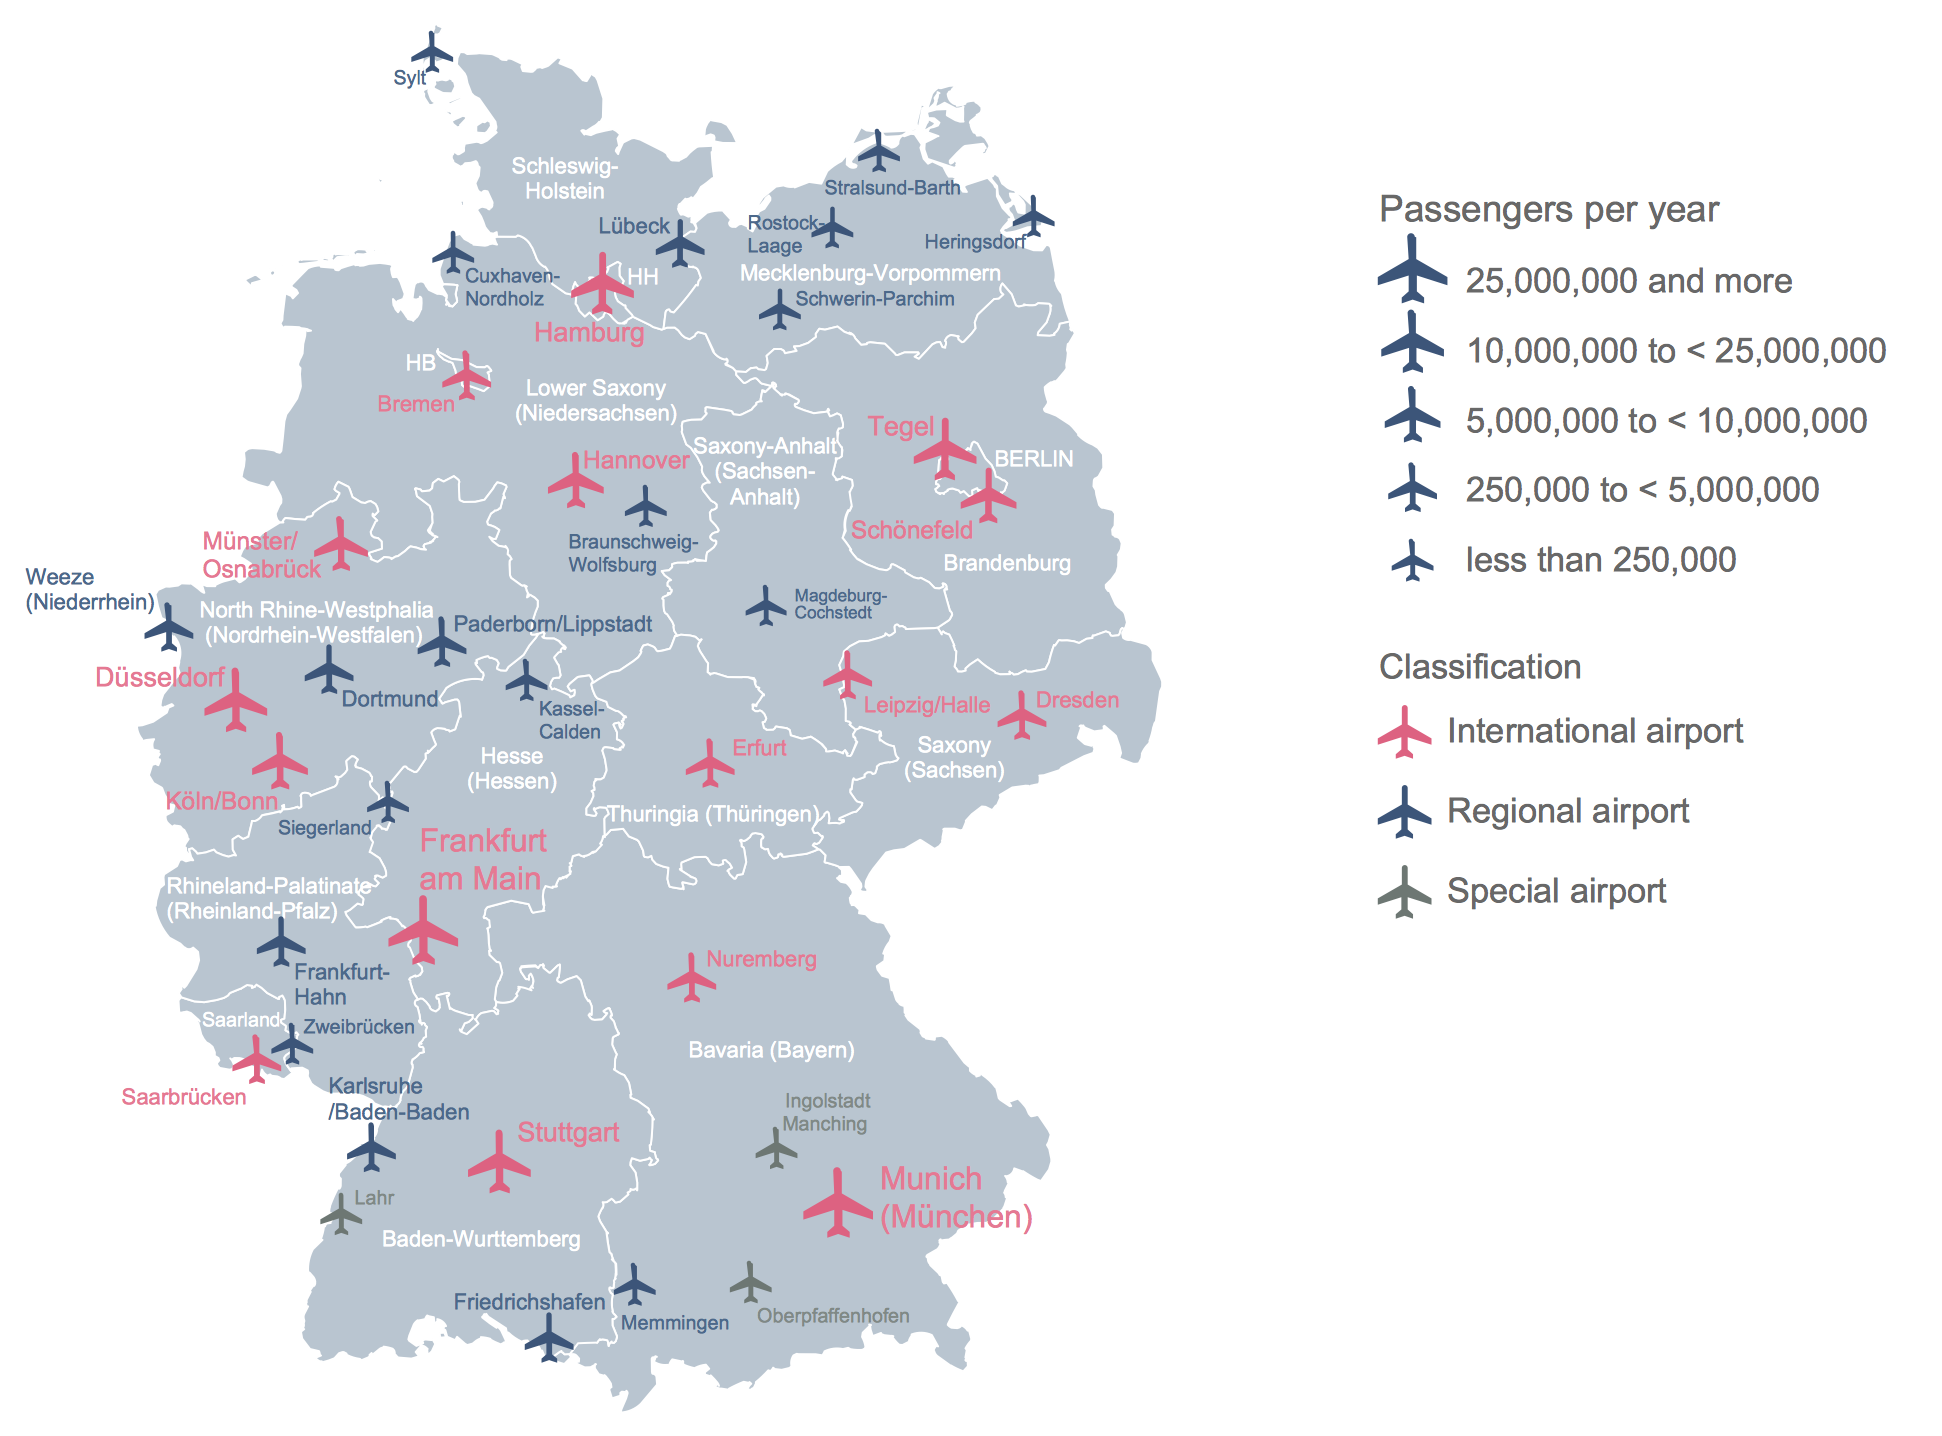
Vector Map of Germany

Vector map is the best way to visually present a world, continents, islands, to display location and boundaries of countries and cities. ConceptDraw DIAGRAM diagramming and vector drawing software offers the Germany Map Solution from the Maps Area of ConceptDraw Solution Park - the best tool for fast and easy drawing vector map of Germany of any degree of detailing, and thematic cartograms and maps of Germany on its base.

Flowchart Symbols Accounting. Activity-based costing (ABC) flowchart

This flow chart example represent activity-based costing flowchart (ABC flowchart): resource-catagories, resource cost drivers, activities, activity cost drivers, cost objects, direct materials, direct labour. This sort of accounting flowcharts intended to explain how costs distributed between company units and departments. There is only way to clearly explain activity-based cost distribution - create cost diagram demonstrating cost distribution relations and logics. ConceptDraw DIAGRAM is special software with accounting flowchart symbols and flowchart stencils for effective drawing activity-based cost flowcharts (ABC-flowcharts).

project,  project management, planning, project changes, solution park PM Response

project,  project management, planning, project changes, solution park
The PM Response solution extends the functional abilities in project management for all three ConceptDraw products by helping to improve the response time to project changes, to plan on how to effectively respond on issues and events impacting the project. It supplies the project managers, team leaders, and all other project participants with wide abilities of iteration planning, creative collaboration, effective decision-making, discussions of the project layout approaches and solving the project challenges, lets them use mind mapping technique for iteration planning and applying the project changes, to represent the projects data as Mind Maps and use them to construct the clear plans, to convert project maps to project implementations, to use different kinds of Visual diagrams to solve the current project problems and to make correct decisions, to plan resources usage and to respond to changes in the project environment.

interactive voice response system, IVR Interactive Voice Response Diagrams

interactive voice response system, IVR
Interactive Voice Response Diagrams solution extends ConceptDraw DIAGRAM software with samples, templates and libraries of ready-to-use vector stencils that help create Interactive Voice Response (IVR) diagrams illustrating in details a work of interactive voice response system, the IVR system’s logical and physical structure, Voice-over-Internet Protocol (VoIP) diagrams, and Action VoIP diagrams with representing voice actions on them, to visualize how the computers interact with callers through voice recognition and dual-tone multi-frequency signaling (DTMF) keypad inputs.

accounting flowchart, accounting cycle, what is the accounting cycle, accounts payable process flow chart, accounts payable flowchart, steps of accounting cycle, accounting flowchart Accounting Flowcharts

accounting flowchart, accounting cycle, what is the accounting cycle, accounts payable process flow chart, accounts payable flowchart, steps of accounting cycle, accounting flowchart
Accounting Flowcharts solution extends ConceptDraw DIAGRAM software with templates, samples and library of vector stencils for drawing the accounting flow charts.

IDEF0 method, IDEF0 notation IDEF0 Diagrams

IDEF0 method, IDEF0 notation
IDEF0 Diagrams visualize system models using the Integration Definition for Function Modeling (IDEF) methodology. Use them for analysis, development and integration of information and software systems, and business process modelling.

Restaurants and cafes are popular places for recreation, relaxation, and are the scene for many impressions and memories, so their construction and design requires special attention. Restaurants must to be projected and constructed to be comfortable and e Cafe and Restaurant Floor Plans

Restaurants and cafes are popular places for recreation, relaxation, and are the scene for many impressions and memories, so their construction and design requires special attention. Restaurants must to be projected and constructed to be comfortable and e
HelpDesk

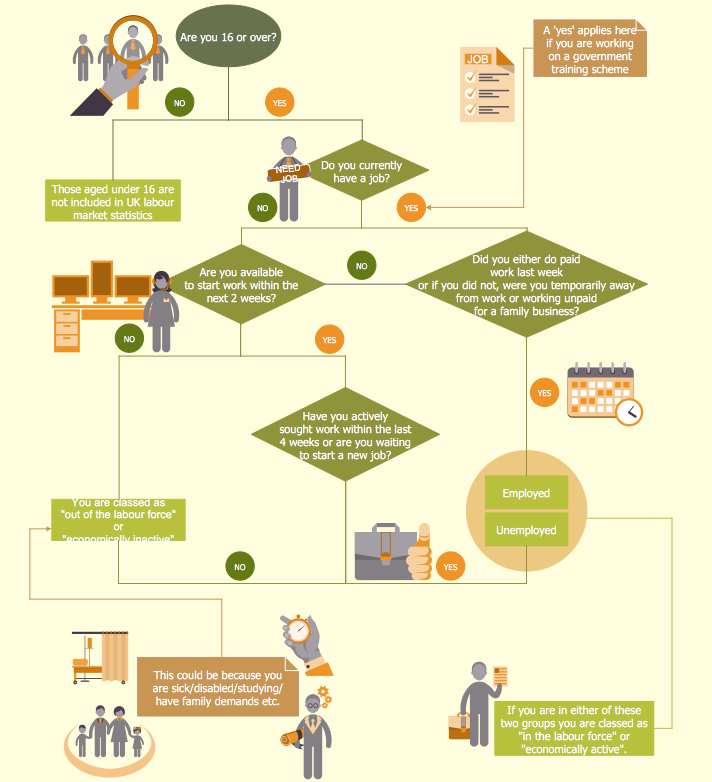
How to Create a HR Process Flowchart

One of the useful tools of each HR specialist is an HR Process Flowchart. HR Flowchart renders step-by-step the process of Human Resource management in any organization. HR flowchart shows the flow of all HR processes, identifies and standardizes the list of mandatory documents required for the implementation of all HR procedures, including the recruiting process. Usually, the descriptions of entire HR processes in a company requires a big set of graphics documents. They must be regularly redrawn to maintain up to date. The best tool for this is ConceptDraw DIAGRAM - the best software to create process flow diagrams of various types. In conjunction with ConceptDraw HR flowchart solution, it delivers comprehensive tool-set for human resource management.