The vector stencils library "Map symbols" contains 19 symbols for labeling the maps.
The pictograms example "Map symbols - Vector stencils library" was created using the ConceptDraw PRO diagramming and vector drawing software extended with the Directional Maps solution from the Maps area of ConceptDraw Solution Park.
The pictograms example "Map symbols - Vector stencils library" was created using the ConceptDraw PRO diagramming and vector drawing software extended with the Directional Maps solution from the Maps area of ConceptDraw Solution Park.
Compass

North

North arrow 1
North arrow 2
North arrow 3
North arrow 4
North arrow 5
Scale
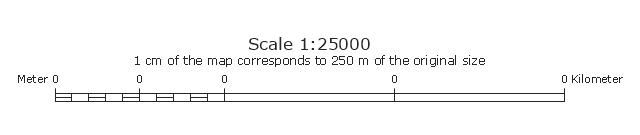
Scale symbol 1

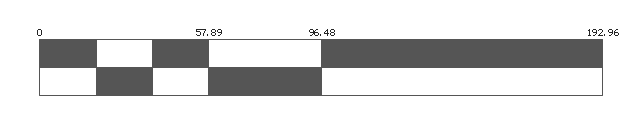
Scale symbol 2
Horizontal

Vertical

Callout

Church

Cathedral

Viewpoint

Castle

Ruins

Curiosity

The vector stencils library Map symbols contains 19 icons for labeling the maps using the ConceptDraw PRO diagramming and vector drawing software.
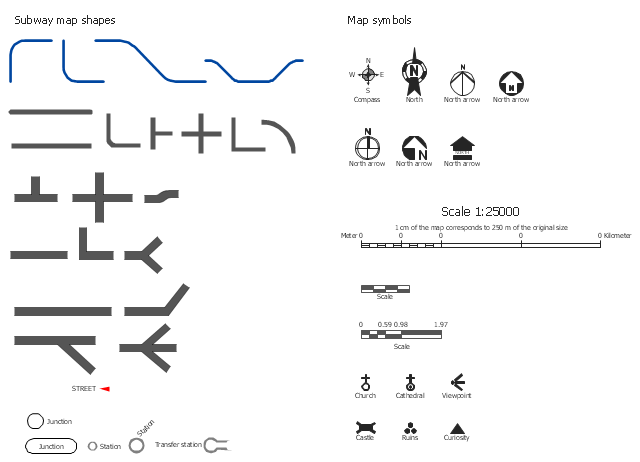
The vector stencils library Subway map contains 41 shapes for creating the subway (tube, metro) maps using the ConceptDraw PRO.
"The various features shown on a map are represented by conventional signs or symbols. For example, colors can be used to indicate a classification of roads. Those signs are usually explained in the margin of the map, or on a separately published characteristic sheet.
Some cartographers prefer to make the map cover practically the entire screen or sheet of paper, leaving no room "outside" the map for information about the map as a whole. These cartographers typically place such information in an otherwise "blank" region "inside" the map -- cartouche, map legend, title, compass rose, bar scale, etc. In particular, some maps contain smaller "sub-maps" in otherwise blank regions—often one at a much smaller scale showing the whole globe and where the whole map fits on that globe, and a few showing "regions of interest" at a larger scale in order to show details that wouldn't otherwise fit." [Map. Wikipedia]
The example "Design elements - Subway map, Map symbols" is included in the Directional Maps solution from the Maps area of ConceptDraw Solution Park.
Map symbols
The vector stencils library "Map symbols" contains 19 symbols for labeling the maps.
The pictograms example "Map symbols - Vector stencils library" was created using the ConceptDraw PRO diagramming and vector drawing software extended with the Directional Maps solution from the Maps area of ConceptDraw Solution Park.
The pictograms example "Map symbols - Vector stencils library" was created using the ConceptDraw PRO diagramming and vector drawing software extended with the Directional Maps solution from the Maps area of ConceptDraw Solution Park.
Compass
North
North arrow 1
North arrow 2
North arrow 3
North arrow 4
North arrow 5
Scale
Scale symbol 1
Scale symbol 2
Horizontal
Vertical
Callout
Church
Cathedral
Viewpoint
Castle
Ruins
Curiosity
The vector stencils library Map symbols contains 19 icons for labeling the maps using the ConceptDraw PRO diagramming and vector drawing software.
The vector stencils library Subway map contains 41 shapes for creating the subway (tube, metro) maps using the ConceptDraw PRO.
"The various features shown on a map are represented by conventional signs or symbols. For example, colors can be used to indicate a classification of roads. Those signs are usually explained in the margin of the map, or on a separately published characteristic sheet.
Some cartographers prefer to make the map cover practically the entire screen or sheet of paper, leaving no room "outside" the map for information about the map as a whole. These cartographers typically place such information in an otherwise "blank" region "inside" the map -- cartouche, map legend, title, compass rose, bar scale, etc. In particular, some maps contain smaller "sub-maps" in otherwise blank regions—often one at a much smaller scale showing the whole globe and where the whole map fits on that globe, and a few showing "regions of interest" at a larger scale in order to show details that wouldn't otherwise fit." [Map. Wikipedia]
The example "Design elements - Subway map, Map symbols" is included in the Directional Maps solution from the Maps area of ConceptDraw Solution Park.
Map symbols
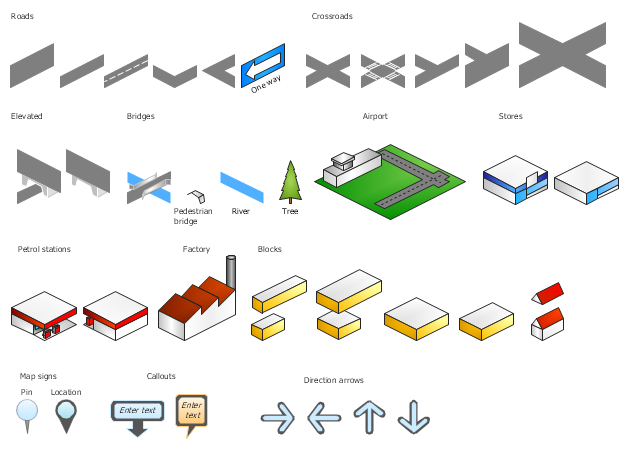
The vector stencils library "3D directional maps" contains 40 symbols for creating pictorial maps, street maps, locator maps, transit maps, tourist maps with points of interest (POI), road maps and route maps using the ConceptDraw PRO diagramming and vector drawing software.
"Pictorial maps are a category of maps that are also loosely called illustrated maps, panoramic maps, perspective maps, bird’s-eye view maps and Geopictorial maps amongst others. In contrast to the regular road map, Atlas or topographic cartography, pictorial maps depict a given territory with a more artistic rather than technical style. The cartography can be a sophisticated 3-D perspective landscape or a simple map graphic enlivened with illustrations of buildings, people and animals. They can feature all sorts of varied topics like historical events, legendary figures or local agricultural products and cover anything from an entire continent to a college campus. ...
Pictorial maps usually show an area as if viewed from above at an oblique angle. They are not generally drawn to scale in order to show street patterns, individual buildings, and major landscape features in perspective. While regular maps focus on the accurate rendition of distances, pictorial maps enhance landmarks and often incorporate a complex interplay of different scales into one image in order to give the viewer a more familiar sense of recognition." [Pictorial maps. Wikipedia]
The design elements library "3D directional maps" is included in the Directional Maps solution from the Maps area of ConceptDraw Solution Park.
3D pictorial map symbols
The vector stencils library "Landmarks" contains 69 landmark symbols of buildings, waterways, scale and directional indicators for labeling transportation and directional maps, road and route maps, street and transit maps, locator and tourist maps.
The pictograms example "Landmarks - Vector stencils library" was created using the ConceptDraw PRO diagramming and vector drawing software extended with the Directional Maps solution from the Maps area of ConceptDraw Solution Park.
The pictograms example "Landmarks - Vector stencils library" was created using the ConceptDraw PRO diagramming and vector drawing software extended with the Directional Maps solution from the Maps area of ConceptDraw Solution Park.
Viewpoint

North arrow
North arrow
Building

Building

Town house
Suburban home

Skyscraper

Town hall

Public house

Petrol station
Gas station
Factory

School

Warehouse
Hospital
Fire station

Train station
Condos

Barn
Motel
Convenience store

Shopping centre

City

Church

Cathedral

National tail train station
Train railway

Bus stop

Tramlink

Marina / Ferry dock

Car ferry

Stop light
Airport

Airport

Underground / Subway / Metro

Taxi

Bicycle parking
Parking

Fuel / Gas / Petrol
Police

Hospital

Wheelchair access
First aid

Telephone

Post office

Landmarks and museums

University

Shopping

Refreshments / Public House

Restrooms / Toilets
Park

Zoo

Information center

Stadium 1
Stadium 2
Park

Tree

Fir-tree

Ocean

Lake

River

Angled river

Forked river

Curved river

Curved river

Flexible river

Bridge

Scale
HelpDesk
How to Create a Directional Map Using ConceptDraw PRO

Examples of Flowcharts, Org Charts and More


Flowchart Software


HelpDesk
How to Change the Measurement Units and Drawing Scale

Pyramid Diagram

How To Draw Building Plans


- Map Symbols Scale Bar
- Design elements - Subway map , Map symbols | Bar Diagrams for ...
- Ruin Map Symbol
- Map symbols - Vector stencils library | Design elements - Subway ...
- Design elements - Subway map , Map symbols | Maps and ...
- Symbol Of Ruins In A Map
- Map symbols - Vector stencils library | Design elements - Subway ...
- Map symbols - Vector stencils library | Design elements - Subway ...
- Map symbols - Vector stencils library
- Map symbols - Vector stencils library
- Map symbols
- Value Stream Mapping Symbols | Map symbols - Vector stencils ...
- Map symbols - Vector stencils library | Map symbols - Vector stencils ...
- Map symbols - Vector stencils library
- Directional Map Symbols
- Map symbols - Vector stencils library | Landmarks - Vector stencils ...
- Map symbols - Vector stencils library | Map symbols - Vector stencils ...
- Map symbols - Vector stencils library
- Map symbols - Vector stencils library | Recreation signs - Vector ...
- Map Scale Vector Art