Business diagrams & Org Charts with ConceptDraw DIAGRAM
The business diagrams are in great demand, they describe the business processes, business tasks and activities which are executed to achieve specific organizational and business goals, increase productivity, reduce costs and errors. They let research and better understand the business processes. ConceptDraw DIAGRAM is a powerful professional cross-platform business graphics and business flowcharting tool which contains hundreds of built-in collections of task-specific vector stencils and templates. They will help you to visualize and structure information, create various Business flowcharts, maps and diagrams with minimal efforts, and add them to your documents and presentations to make them successful. Among them are Data flow diagrams, Organization charts, Business process workflow diagrams, Audit flowcharts, Cause and Effect diagrams, IDEF business process diagrams, Cross-functional flowcharts, PERT charts, Timeline diagrams, Calendars, Marketing diagrams, Pyramids, Target diagrams, Venn diagrams, Comparison charts, Analysis charts, Dashboards, and many more. Being a cross-platform application, ConceptDraw DIAGRAM is very secure, handy, free of bloatware and one of the best alternatives to Visio for Mac users.
 Matrices
This solution extends ConceptDraw DIAGRAM software with samples, templates and library of design elements for drawing the business matrix diagrams.
 Marketing Diagrams
Marketing Diagrams solution extends ConceptDraw DIAGRAM diagramming software with abundance of samples, templates and vector design elements intended for easy graphical visualization and drawing different types of Marketing diagrams and graphs, including Branding Strategies Diagram, Five Forces Model Diagram, Decision Tree Diagram, Puzzle Diagram, Step Diagram, Process Chart, Strategy Map, Funnel Diagram, Value Chain Diagram, Ladder of Customer Loyalty Diagram, Leaky Bucket Diagram, Promotional Mix Diagram, Service-Goods Continuum Diagram, Six Markets Model Diagram, Sources of Customer Satisfaction Diagram, etc. Analyze effectively the marketing activity of your company and apply the optimal marketing methods with ConceptDraw DIAGRAM software.
 ConceptDraw Solution Park
ConceptDraw Solution Park collects graphic extensions, examples and learning materials
 Marketing
This solution extends ConceptDraw DIAGRAM and ConceptDraw MINDMAP with Marketing Diagrams and Mind Maps (brainstorming, preparing and holding meetings and presentations, sales calls).
 Target and Circular Diagrams
This solution extends ConceptDraw DIAGRAM software with samples, templates and library of design elements for drawing the Target and Circular Diagrams.
 Pyramid Diagrams
Pyramid Diagrams solution extends ConceptDraw DIAGRAM software with templates, samples and library of vector stencils for drawing the marketing pyramid diagrams.
HelpDesk
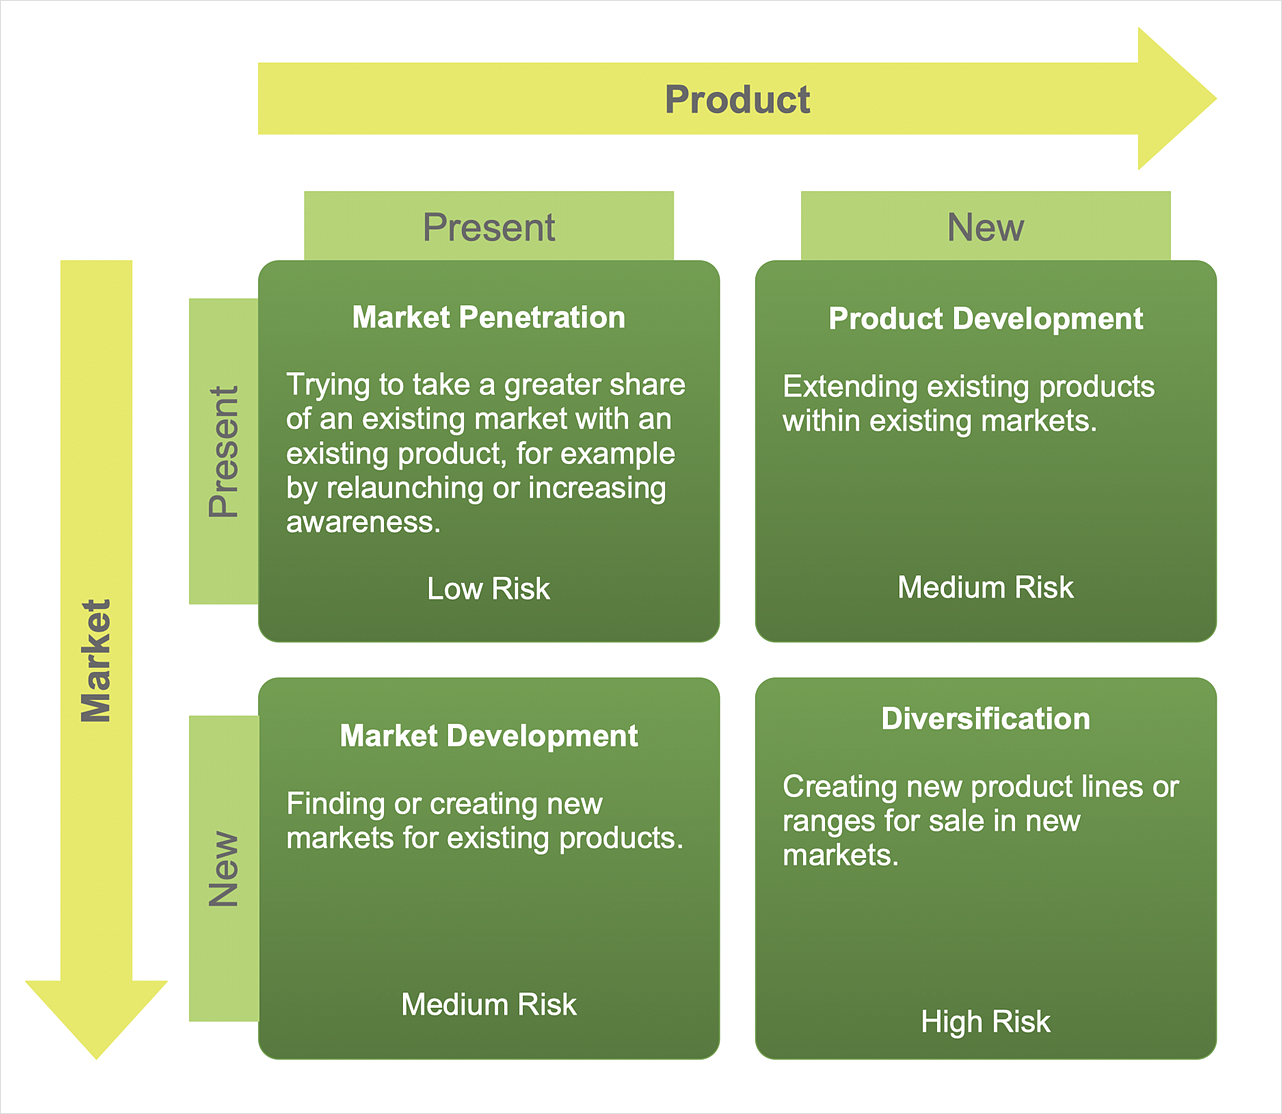
How to Make an Ansoff Matrix Template
Ansoff Matrix is a business strategic management tool that helps a business determine its product and market growth strategy. Ansoff matrix has four sections to show each impacting ways that businesses can grow. Using Ansoff Matrix enables determining the current position of any business in the industry and choose the direction of its growth, which would provide the most competitive position. While Ansoff Matrix is most commonly used as a business planning tool it can be used also for personal development. You can make Ansoff Matrix template for your organization using ConceptDraw DIAGRAM Matrices solution.- Flowchart Marketing Process. Flowchart Examples | Selecting ...
- Flowchart Example: Flow Chart of Marketing Analysis | Good Flow ...
- Flowchart Example: Flow Chart of Marketing Analysis | Marketing ...
- Flowchart Example: Flow Chart of Marketing Analysis
- Marketing | Marketing Analysis Diagram | Marketing Diagrams ...
- Pie Chart Software | Marketing Analysis Diagram | Flowchart ...
- Circle-spoke diagram template - Target market | Pie Chart Examples ...
- Flowchart Example: Flow Chart of Marketing Analysis | Good Flow ...
- Flowchart Example: Flow Chart of Marketing Analysis
- Create Graphs and Charts | Line Graph Charting Software ...
- Marketing | Circle-spoke diagram template - Target market ...
- Marketing | Target and Circular Diagrams | Target market - Onion ...
- Marketing | Block diagram - Six markets model | Pyramid Diagram ...
- Bubble Diagrams | Process Flowchart | Basic Diagramming | Bubble ...
- Marketing and Sales Organization chart . Organization chart Example
- Marketing Diagrams | Pyramid Chart Examples | Circle-spoke ...
- Marketing and Sales Organization chart . Organization chart Example
- Pyramid Diagram and Pyramid Chart | Pyramid Chart Examples ...
- Picture Graphs | Marketing Analysis Diagram | Flowchart Example ...
- Circle-spoke diagram template - Target market | Arrow circle chart ...

