 ConceptDraw Solution Park
ConceptDraw Solution Park collects graphic extensions, examples and learning materials
HelpDesk
How to Draw a Circular Arrows Diagram
The cyclic recurrence is a fundamental property of multiple systems. The cycle is a process which consists from elements (phases, stages, stages) following each other. Many processes in astronomy, biology, chemistry, physics, mathematics, etc. have a cycle properties. It is also widely used in information technologies and marketing analysis. Graphical representation of cyclic processes can have many forms. It can be a circle, parabola, hyperbola, ellipse and others. A Circular Arrows Diagram is used as one of the statistical charts in the business, mass media and marketing. ConceptDraw DIAGRAM provides its users tools for making easy drawing Circular Arrows Diagrams.What Is a Concept Map
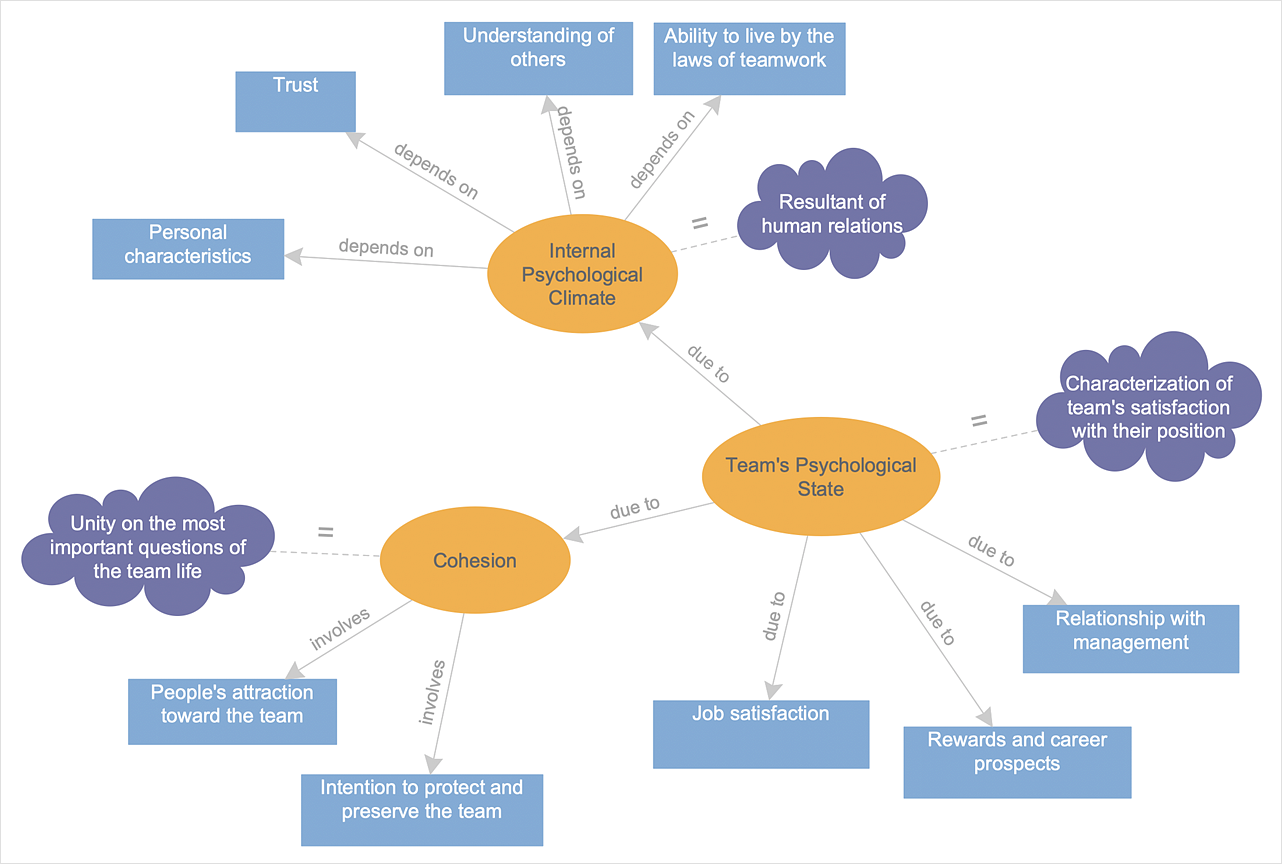
What is a Concept Map and what software is effective for its design? A concept map or conceptual diagram is a diagram that depicts suggested relationships between concepts. As for effective software - we suggest you to pay attention for the ConceptDraw DIAGRAM diagramming and vector drawing software. Extended with Concept Maps Solution from the "Diagrams" Area it is a real godsend for you.Concept Maps
As concept map consists from conception-blocks and links between them, you can use ConceptDraw library objects and add to a document as much objects as you need. ConceptDraw tools let you to edit, group, move objects, change their appearance and add text signs and raster or vector pictures. ConceptDraw DIAGRAM diagramming and vector drawing software extended with Concept Maps Solution from the "Diagrams" Area is effective tool for creating professional looking Concept Maps.Competitor Analysis
Competitor analysis is a first and obligatory step in elaboration the proper corporate marketing strategy and creating sustainable competitive advantage. Use powerful opportunities of numerous solutions from ConceptDraw Solution Park for designing illustrative diagrams, charts, matrices which are necessary for effective competitor analysis.What is SWOT Analysis in Marketing
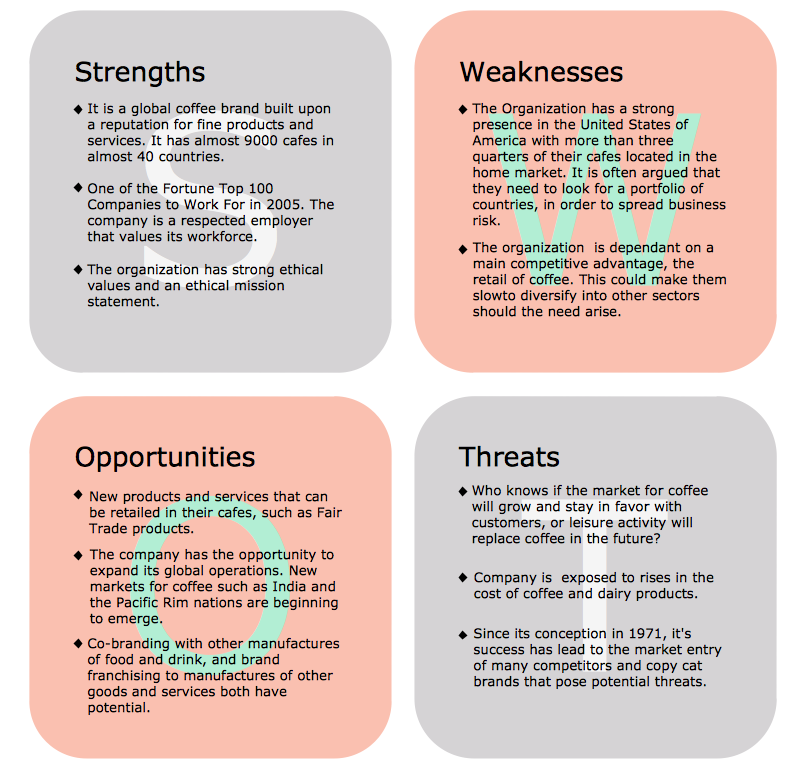
What is SWOT analysis in marketing? SWOT analysis gives for analysts, marketing specialists and other professionals the perfect ability to identify the positives and negatives in an organization, as well as in the external environment. The SWOT and TOWS methods were developed for business and industry, they involve the specifying of a project's objective and identifying internal and external causes for accomplishing the project goals. A full awareness about the situation within and around your business can help effectively with both strategic planning and decision-making. ConceptDraw DIAGRAM and ConceptDraw MINDMAP software allow professionals to make the situation analysis, to develop strategies and plans for achievement defined objectives, to suppose the possible scenarios of further activity, to see the whole situation at a glance, to create well-designed SWOT and TOWS matrices in minutes. The SWOT and TOWS Matrix Diagrams solution from ConceptDraw Solution Park includes the SWOT matrix samples and templates that allow users quickly create their own SWOT and TOWS diagrams.HelpDesk
How to Create a Concept Map
The graphical technique of knowledge representation in the form of structured networks of concepts (ideas) is called concept mapping. Concept network consists of shapes that represent concepts and connectors representing relationships between concepts. The difference between mind maps and concept maps is that a mind map has only one object depicting the main idea, while a concept map may have several. Concept mapping is used to structure ideas, to communicate a complex system of knowledge, to help the learning process, etc. ConceptDraw DIAGRAM allows you to draw concept maps using the Concept Map solution.
 Marketing Diagrams
Marketing Diagrams solution extends ConceptDraw DIAGRAM diagramming software with abundance of samples, templates and vector design elements intended for easy graphical visualization and drawing different types of Marketing diagrams and graphs, including Branding Strategies Diagram, Five Forces Model Diagram, Decision Tree Diagram, Puzzle Diagram, Step Diagram, Process Chart, Strategy Map, Funnel Diagram, Value Chain Diagram, Ladder of Customer Loyalty Diagram, Leaky Bucket Diagram, Promotional Mix Diagram, Service-Goods Continuum Diagram, Six Markets Model Diagram, Sources of Customer Satisfaction Diagram, etc. Analyze effectively the marketing activity of your company and apply the optimal marketing methods with ConceptDraw DIAGRAM software.
The Best Mac Software for Diagramming or Drawing
ConceptDraw DIAGRAM is a powerful intelligent vector graphics engine that can be used to create basic diagrams including flowcharts, charts, workflows, flowcharts, organizational charts, business diagram, learn business diagrams, flow diagrams.
 Matrices
This solution extends ConceptDraw DIAGRAM software with samples, templates and library of design elements for drawing the business matrix diagrams.
Flowchart Marketing Process. Flowchart Examples
This sample shows the Flowchart that displays the layout and work flow of the cloud marketing platform. This diagram has a style of the marketing brochure. This style displays the central product that is related to the other issues. Using the ready-to-use predesigned objects, samples and templates from the Flowcharts Solution for ConceptDraw DIAGRAM you can create your own professional looking Flowchart Diagrams quick and easy.- Concept Map Of Marketing
- Internet marketing - Concept map | What Is a Concept Map | Leaky ...
- Societal Marketing Concept Diagram
- Internet marketing - Concept map | What Is a Concept Map ...
- Internet marketing - Concept map
- Internet marketing - Concept map | How to Draw a Circular Arrows ...
- Marketing | Internet marketing - Concept map | Positioning Map ...
- Marketing Concept Examples
- Internet marketing professions | Internet Marketing Infographic ...
- Marketing - Vector stencils library | Internet marketing - Concept map ...
- Internet marketing - Concept map | Concept Maps | What Is a ...
- Internet marketing - Concept map | The Best Flowchart Software ...
- Diagram Of Societal Marketing Concept
- Internet marketing - Concept map | What Is a Concept Map | Concept ...
- What Is a Concept Map | Internet marketing - Concept map | Concept ...
- Internet marketing - Concept map | The Best Mac Software for ...
- Concept Of Marketing With Diagram
- What Is a Concept Map | Internet marketing - Concept map | How to ...
- Marketing Concept With Graph
- Online shop - Concept map | Concept Map | Internet marketing ...


