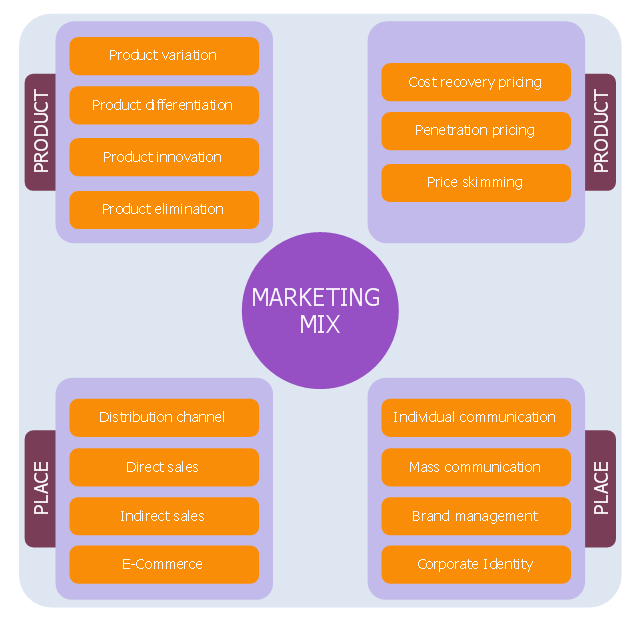
This diagram sample depicts marketing mix. It was designed on the base of the Wikimedia Commons file: Marketing-Mix (en).png.
[commons.wikimedia.org/ wiki/ File:Marketing-Mix_ %28en%29.png]
"The marketing mix is a business tool used in marketing and by marketeers . The marketing mix is often crucial when determining a product or brand's offer, and is often associated with the four P's: price, product, promotion, and place. In service marketing, however, the four Ps are expanded to the seven P's or eight P's to address the different nature of services.
In the 1990s, the concept of four C's was introduced as a more customer-driven replacement of four P's. There are two theories based on four Cs: Lauterborn's four Cs (consumer, cost, communication, convenience), and Shimizu's four Cs (commodity, cost, communication, channel).
In 2012, a new four P's theory was proposed with people, processes, programs, and performance." [Marketing mix. Wikipedia]
The chart example "Marketing mix diagram" was created using the ConceptDraw PRO diagramming and vector drawing software extended with the Marketing Diagrams solution from the Marketing area of ConceptDraw Solution Park.
Chart example
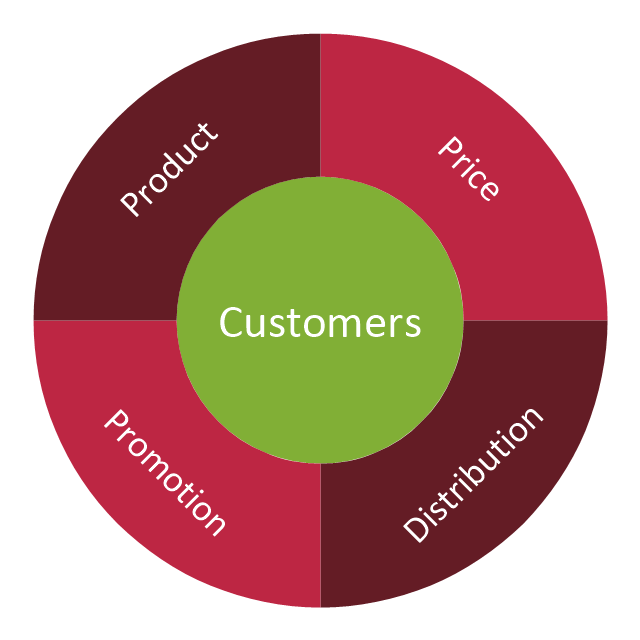
"A target market is a group of customers that the business has decided to aim its marketing efforts and ultimately its merchandise towards. A well-defined target market is the first element to a marketing strategy. The marketing mix variables of product, place (distribution), promotion and price are the four elements of a marketing mix strategy that determine the success of a product in the marketplace." [Target market. Wikipedia]
"An onion diagram is a kind of chart that shows the dependencies among parts of an organization or process. The chart displays items in concentric circles, where the items in each ring depend on the items in the smaller rings. ...
The Onion Diagram is able to show layers of a complete system in a few circles. Each of the circles is able to represent a component that is dependent upon the component on the inside of it shown by the circle inside of it. The main concept of the diagram is shown by the center circle of the diagram. This chart is used due to the fact that it has a clear visual representation that is easy to read, and it has a strong visual impact." [Onion diagram. Wikipedia]
This onion diagram (target diagram) example "Target market" was created using the ConceptDraw PRO diagramming and vector drawing software extended with the Target and Circular Diagrams solution from the Marketing area of ConceptDraw Solution Park.
www.conceptdraw.com/ solution-park/ marketing-target-and-circular-diagrams
Onion diagram

 Marketing Diagrams
Marketing Diagrams solution extends ConceptDraw DIAGRAM diagramming software with abundance of samples, templates and vector design elements intended for easy graphical visualization and drawing different types of Marketing diagrams and graphs, including Branding Strategies Diagram, Five Forces Model Diagram, Decision Tree Diagram, Puzzle Diagram, Step Diagram, Process Chart, Strategy Map, Funnel Diagram, Value Chain Diagram, Ladder of Customer Loyalty Diagram, Leaky Bucket Diagram, Promotional Mix Diagram, Service-Goods Continuum Diagram, Six Markets Model Diagram, Sources of Customer Satisfaction Diagram, etc. Analyze effectively the marketing activity of your company and apply the optimal marketing methods with ConceptDraw DIAGRAM software.
 Target and Circular Diagrams
This solution extends ConceptDraw DIAGRAM software with samples, templates and library of design elements for drawing the Target and Circular Diagrams.
Business Productivity - Marketing

Competitor Analysis

This wheel diagram sample was created on the base of figure illustrating the webpage "Chapter 3: Current State of the Ecosystem" of the website of the National Broadband Plan of US Federal Communications Comission (FCC). "The broadband ecosystem includes applications and content: e-mail, search, news, maps, sales and marketing applications used by businesses, user-generated video and hundreds of thousands of more specialized uses. Ultimately, the value of broadband is realized when it delivers useful applications and content to end-users.
Applications run on devices that attach to the network and allow users to communicate: computers, smartphones, set-top boxes, e-book readers, sensors, private branch exchanges (PBX), local area network routers, modems and an ever-growing list of other devices. New devices mean new opportunities for applications and content.
Finally, broadband networks can take multiple forms: wired or wireless, fixed or mobile, terrestrial or satellite. Different types of networks have different capabilities, benefits and costs.
The value of being connected to the network increases as more people and businesses choose to adopt broadband and use applications and devices that the network supports. Several factors contribute to their decisions. These include whether they can afford a connection, whether they are comfortable with digital technology and whether they believe broadband is useful.
Networks, devices and applications drive each other in a virtuous cycle. If networks are fast, reliable and widely available, companies produce more powerful, more capable devices to connect to those networks. These devices, in turn, encourage innovators and entrepreneurs to develop exciting applications and content. These new applications draw interest among end-users, bring new users online and increase use among those who already subscribe to broadband services. This growth in the broadband ecosystem reinforces the cycle, encouraging service providers to boost the speed, functionality and reach of their networks."
[broadband.gov/ plan/ 3-current-state-of-the-ecosystem/ ]
The circle pie chart example "Forces shaping the broadband ecosystem in the US" was created using the ConceptDraw PRO diagramming and vector drawing software extended with the Target and Circular Diagrams solution from the Marketing area of ConceptDraw Solution Park.
www.conceptdraw.com/ solution-park/ marketing-target-and-circular-diagrams
Wheel diagram

The vector stencils library "Circular diagrams" contains 42 templates of circular diagrams: circular arrow diagram, circular motion diagram, arrow ring chart, doughnut chart (donut chart), circle pie chart, diamond pie chart, circle diagram, pie chart, ring chart, loop diagram, block loop diagram, arrow loop circle, crystal diagram, triangular diagram, diamond diagram, pentagon diagram, hexagon diagram, heptagon diagram, cycle diagram (cycle chart), stacked Venn diagram (onion diagram), arrow circle diagram.
Use these shapes to illustrate your marketing and sales documents, presentations, webpages and infographics in the ConceptDraw PRO diagramming and vector drawing software extended with the Target and Circular Diagrams solution from the Marketing area of ConceptDraw Solution Park.
www.conceptdraw.com/ solution-park/ marketing-target-and-circular-diagrams
Circular arrow diagram 1
Circular arrow diagram 2
Arrow ring chart
Doughnut chart

Diamond pie chart

Pie chart

Circle diagram

Circle pie chart 2

Circle pie chart 1

Ring chart 1 - 3 elements

Ring chart 1 - 4 elements

Ring chart 1 - 5 elements

Ring chart 1 - 6 elements

Ring chart 1 - 7 elements

Ring chart 2 - 3 elements

Ring chart 2 - 4 elements

Ring chart 2 - 5 elements

Ring chart 2 - 6 elements

Ring chart 2 - 7 elements

Crystal diagram - 3 elements

Crystal diagram - 4 elements

Crystal diagram - 5 elements

Crystal diagram - 6 elements

Crystal diagram - 7 elements

Stacked Venn diagram - 4

Stacked Venn diagram - 5

Stacked Venn diagram - 6

Stacked Venn diagram - 7

Basic loop diagram

Block loop diagram

Arrow loop circle
Arrow loop - 3 circles
Arrow loop - 4 circles
Arrow loop - 5 circles
Arrow loop - 6 circles
Arrow loop - 7 circles
Arrow circle diagram - 3
Arrow circle diagram - 4
Stacked Venn diagram - 3

Arrow circle diagram - 5
Arrow circle diagram - 6
Arrow circle diagram - 7
This diagram sample depicts marketing mix. It was designed on the base of the Wikimedia Commons file: Marketing-Mix (en).png.
[commons.wikimedia.org/ wiki/ File:Marketing-Mix_ %28en%29.png]
"The marketing mix is a business tool used in marketing and by marketeers . The marketing mix is often crucial when determining a product or brand's offer, and is often associated with the four P's: price, product, promotion, and place. In service marketing, however, the four Ps are expanded to the seven P's or eight P's to address the different nature of services.
In the 1990s, the concept of four C's was introduced as a more customer-driven replacement of four P's. There are two theories based on four Cs: Lauterborn's four Cs (consumer, cost, communication, convenience), and Shimizu's four Cs (commodity, cost, communication, channel).
In 2012, a new four P's theory was proposed with people, processes, programs, and performance." [Marketing mix. Wikipedia]
The chart example "Marketing mix diagram" was created using the ConceptDraw PRO diagramming and vector drawing software extended with the Marketing Diagrams solution from the Marketing area of ConceptDraw Solution Park.
[commons.wikimedia.org/ wiki/ File:Marketing-Mix_ %28en%29.png]
"The marketing mix is a business tool used in marketing and by marketeers . The marketing mix is often crucial when determining a product or brand's offer, and is often associated with the four P's: price, product, promotion, and place. In service marketing, however, the four Ps are expanded to the seven P's or eight P's to address the different nature of services.
In the 1990s, the concept of four C's was introduced as a more customer-driven replacement of four P's. There are two theories based on four Cs: Lauterborn's four Cs (consumer, cost, communication, convenience), and Shimizu's four Cs (commodity, cost, communication, channel).
In 2012, a new four P's theory was proposed with people, processes, programs, and performance." [Marketing mix. Wikipedia]
The chart example "Marketing mix diagram" was created using the ConceptDraw PRO diagramming and vector drawing software extended with the Marketing Diagrams solution from the Marketing area of ConceptDraw Solution Park.
Chart example
This circle pie chart sample was created on the base of the figure illustrating the article "Impacts of Parking Strategies" from the Chicago Metropolitan Agency for Planning website. "Todd Litman's "Cycle of Automobile Dependency" shows how auto-centric land use planning and excessive parking supply have created this situation. Parking management strategies can be used to break this cycle, by changing development patterns and improving travel options (2006)." [cmap.illinois.gov/ about/ 2040/ supporting-materials/ process-archive/ strategy-papers/ parking/ impacts-of-parking-strategies]
The circle pie chart example "Cycle of automobile dependency" was created using the ConceptDraw PRO diagramming and vector drawing software extended with the Target and Circular Diagrams solution from the Marketing area of ConceptDraw Solution Park.
www.conceptdraw.com/ solution-park/ marketing-target-and-circular-diagrams
Circle pie chart

Marketing Plan Infographic

"Brand essence is a phrase that communicates the fundamental nature of a trade name associated with one or more products made by the same company. A business marketing team will often spend considerable time developing effective ways of expressing the brand essence of their company's various brands by highlighting the unique benefits provided that pertain to the values of its target subculture." [businessdictionary.com/ definition/ brand-essence.html]
Brand essence model diagram visually display key points of brand essence in easy to understand form.
The example of wheel diagram (ring diagram, bevel style circle diagram) "Brand essence model" was created using the ConceptDraw PRO diagramming and vector drawing software extended with the Target and Circular Diagrams solution from the Marketing area of ConceptDraw Solution Park.
www.conceptdraw.com/ solution-park/ marketing-target-and-circular-diagrams
Wheel diagram

Pyramid Chart Examples

This wheel diagram sample was created on the base of figure illustrating the webpage "Chapter 3: Current State of the Ecosystem" of the website of the National Broadband Plan of US Federal Communications Comission (FCC). "The broadband ecosystem includes applications and content: e-mail, search, news, maps, sales and marketing applications used by businesses, user-generated video and hundreds of thousands of more specialized uses. Ultimately, the value of broadband is realized when it delivers useful applications and content to end-users.
Applications run on devices that attach to the network and allow users to communicate: computers, smartphones, set-top boxes, e-book readers, sensors, private branch exchanges (PBX), local area network routers, modems and an ever-growing list of other devices. New devices mean new opportunities for applications and content.
Finally, broadband networks can take multiple forms: wired or wireless, fixed or mobile, terrestrial or satellite. Different types of networks have different capabilities, benefits and costs.
The value of being connected to the network increases as more people and businesses choose to adopt broadband and use applications and devices that the network supports. Several factors contribute to their decisions. These include whether they can afford a connection, whether they are comfortable with digital technology and whether they believe broadband is useful.
Networks, devices and applications drive each other in a virtuous cycle. If networks are fast, reliable and widely available, companies produce more powerful, more capable devices to connect to those networks. These devices, in turn, encourage innovators and entrepreneurs to develop exciting applications and content. These new applications draw interest among end-users, bring new users online and increase use among those who already subscribe to broadband services. This growth in the broadband ecosystem reinforces the cycle, encouraging service providers to boost the speed, functionality and reach of their networks."
[broadband.gov/ plan/ 3-current-state-of-the-ecosystem/ ]
The circle pie chart example "Forces shaping the broadband ecosystem in the US" was created using the ConceptDraw PRO diagramming and vector drawing software extended with the Target and Circular Diagrams solution from the Marketing area of ConceptDraw Solution Park.
www.conceptdraw.com/ solution-park/ marketing-target-and-circular-diagrams
Applications run on devices that attach to the network and allow users to communicate: computers, smartphones, set-top boxes, e-book readers, sensors, private branch exchanges (PBX), local area network routers, modems and an ever-growing list of other devices. New devices mean new opportunities for applications and content.
Finally, broadband networks can take multiple forms: wired or wireless, fixed or mobile, terrestrial or satellite. Different types of networks have different capabilities, benefits and costs.
The value of being connected to the network increases as more people and businesses choose to adopt broadband and use applications and devices that the network supports. Several factors contribute to their decisions. These include whether they can afford a connection, whether they are comfortable with digital technology and whether they believe broadband is useful.
Networks, devices and applications drive each other in a virtuous cycle. If networks are fast, reliable and widely available, companies produce more powerful, more capable devices to connect to those networks. These devices, in turn, encourage innovators and entrepreneurs to develop exciting applications and content. These new applications draw interest among end-users, bring new users online and increase use among those who already subscribe to broadband services. This growth in the broadband ecosystem reinforces the cycle, encouraging service providers to boost the speed, functionality and reach of their networks."
[broadband.gov/ plan/ 3-current-state-of-the-ecosystem/ ]
The circle pie chart example "Forces shaping the broadband ecosystem in the US" was created using the ConceptDraw PRO diagramming and vector drawing software extended with the Target and Circular Diagrams solution from the Marketing area of ConceptDraw Solution Park.
www.conceptdraw.com/ solution-park/ marketing-target-and-circular-diagrams
Wheel diagram
Target Diagram

Business World Presentation

"The marketing mix is a business tool used in marketing and by marketing professionals. The marketing mix is often crucial when determining a product or brand's offer, and is often synonymous with the four Ps: price, product, promotion, and place ..." [Marketing mix. Wikipedia]
The example of wheel diagram (ring diagram, bevel style circle diagram, circular diagram) "Marketing mix" was created using the ConceptDraw PRO diagramming and vector drawing software extended with the Target and Circular Diagrams solution from the Marketing area of ConceptDraw Solution Park.
www.conceptdraw.com/ solution-park/ marketing-target-and-circular-diagrams
Marketing mix - Wheel diagram
The vector stencils library "Sales KPIs and Metrics" contains 15 chart templates and graphic indicators of sales key performance indicators (KPIs) and metrics for drawing sales dashboards: line charts "Cost per order" and "Clicks from Sales Follow-Up Emails", column charts "Social Media Usage" and "Usage Rate of Marketing Collateral", horizontal bar charts "Rate of Follow Up Contact", "Cost per customer" and "Lead Response Time", pie charts "Product mix", "Product Performance" and "Rate of Contact", gauge (speedometer) indicators "Sales Growth" and "Actual vs Plan", bullet indicator "Sales Target", diamond alarm indicators "Average Purchase Value", "Quote to Close Ratio", "Opportunity-to-Win Ratio" and "Sales Ratio".
The dashboard charts and indicators example "Design elements - Sales KPIs and metrics" for the ConceptDraw PRO diagramming and vector drawing software is included in the Sales Dashboard solution from the Marketing area of ConceptDraw Solution Park.
www.conceptdraw.com/ solution-park/ marketing-sales-dashboard
Sales dashboard charts and graphic indicators

This circular diagram sample was created on the base of the figure from the Florence-Darlington Technical College website. [bus.fdtc.edu/ sbed/ core/ core7.html]
"A marketing plan may be part of an overall business plan. Solid marketing strategy is the foundation of a well-written marketing plan. While a marketing plan contains a list of actions, a marketing plan without a sound strategic foundation is of little use. ...
A marketing plan for a small business typically includes Small Business Administration Description of competitors, including the level of demand for the product or service and the strengths and weaknesses of competitors:
(1) Description of the product or service, including special features.
(2) Marketing budget, including the advertising and promotional plan.
(3) Description of the business location, including advantages and disadvantages for marketing.
(4) Pricing strategy.
(5) Market Segmentation." [Marketing plan. Wikipedia]
The circular diagram example "Marketing plan" was created using the ConceptDraw PRO diagramming and vector drawing software extended with the Target and Circular Diagrams solution from the Marketing area of ConceptDraw Solution Park.
www.conceptdraw.com/ solution-park/ marketing-target-and-circular-diagrams
Circular diagram

The vector stencils library "Sales KPIs and Metrics" contains 15 chart templates and graphic indicators of sales key performance indicators (KPIs) and metrics.
Use it for drawing sales dashboards in the ConceptDraw PRO diagramming and vector drawing software extended with the Sales Dashboard solution from the Marketing area of ConceptDraw Solution Park.
Use it for drawing sales dashboards in the ConceptDraw PRO diagramming and vector drawing software extended with the Sales Dashboard solution from the Marketing area of ConceptDraw Solution Park.
Actual vs Plan

Average Purchase Value

Clicks from Sales Follow-Up Emails

Cost per customer

Cost per order

Lead Response Time

Opportunity-to-Win Ratio

Product mix

Product Performance

Rate of Contact

Rate of Follow Up Contact

Sales Growth

Sales Target

Social Media Usage

Usage Rate of Marketing Collateral

- Marketing Mix Flow Chart
- Marketing mix - Wheel diagram | Target diagrams - Vector stencils ...
- Marketing Mix In Marketing Graphs
- Graph Or Diagram Product Mix In Service Marketing
- Marketing Diagrams | Marketing plan - Circular diagram | Target ...
- Marketing plan - Circular diagram | Marketing Analysis Diagram ...
- Pie Chart Marketing Mix Products
- Product Mix Diagram Template
- Marketing mix - Wheel diagram | Marketing plan - Circular diagram ...
- Promotion Mix Chart Or Graph
- Marketing mix - Wheel diagram | Marketing Diagrams | Target ...
- Marketing Mix Chart Template
- Marketing mix - Wheel diagram | Marketing | Circle-spoke diagram ...
- Daigrams For Marketing Mix
- Daily Schedule Chart | Target Diagram | Business Productivity ...
- Marketing Analysis Diagram | Flowchart Marketing Process ...
- Marketing Mix In Process Diagram
- Social strategy - Pyramid diagram | Target market - Onion diagram ...
- Marketing | Marketing mix - Wheel diagram | Target market ...