HelpDesk
How to Draw Chemistry Structures
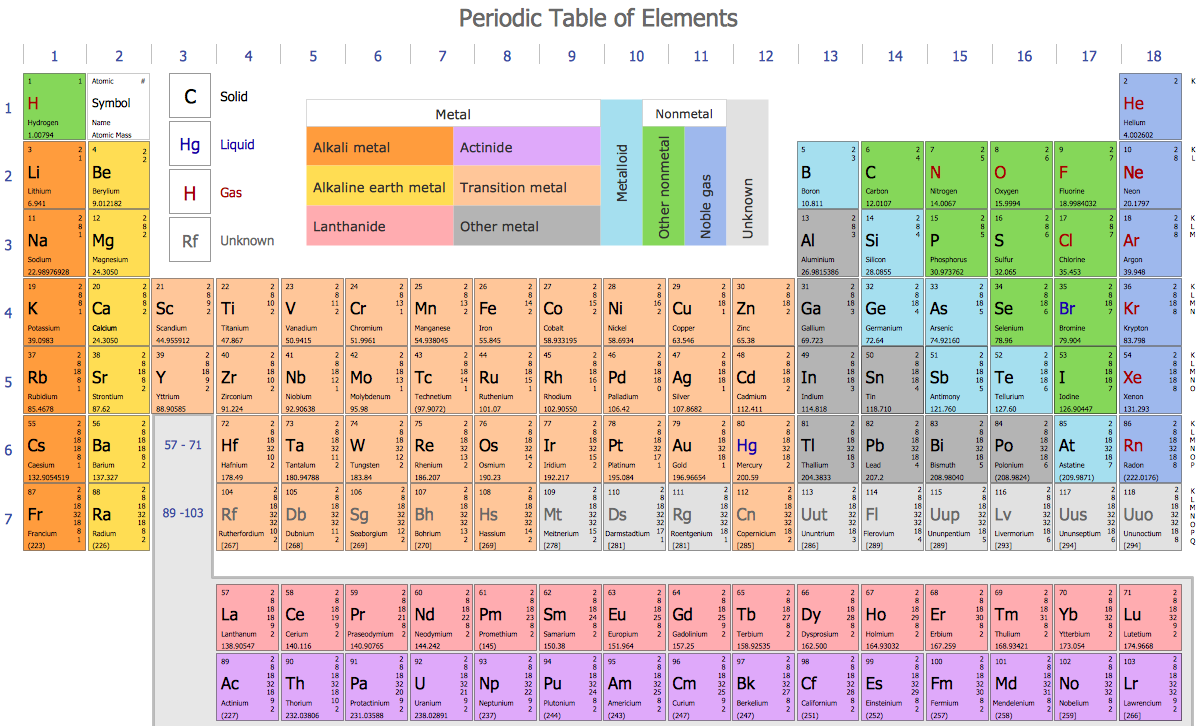
Making chemistry drawings for science and education purposes involves many different elements that can be managed using ConceptDraw PRO. ConceptDraw Chemistry solution can be used as a tool for creating chemical schemes and diagrams of chemical lab set-ups and labware, formulas, reaction schemes, and molecular structures. With ConceptDraw PRO you can easily create and communicate chemistry drawings of any complexity.HelpDesk
How to Draw Biology Diagram in ConceptDraw PRO
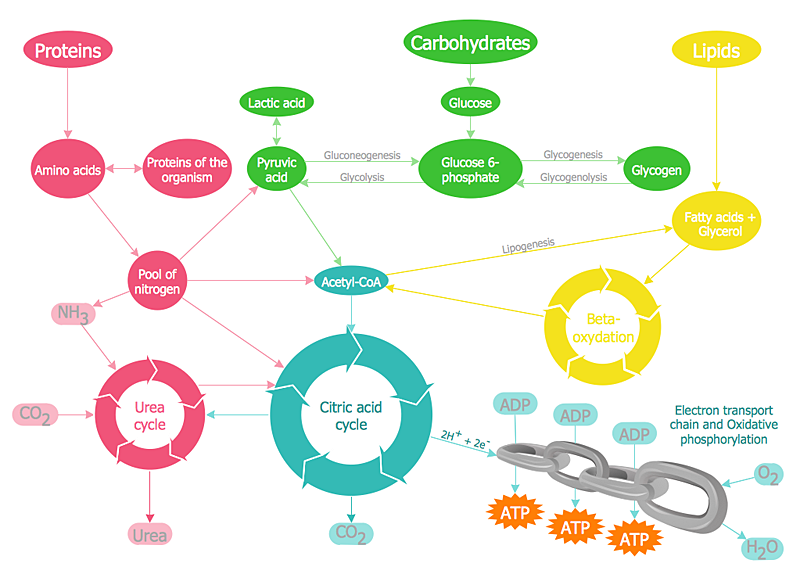
Biology is the science studying the living forms of life. A good starting point when studying biology is to use drawings. Drawings help students to comprehend and remember knowledge that is difficult to explain and understand. Students are used to draw various specific diagrams such as the human circulatory systems or schemes of various biochemical processes. Researchers also need to complete their work with a variety of related diagrams and illustrations. ConceptDraw Biology solution allows you to draw various biological diagrams and schemes easily.HelpDesk
How to Create Data-driven Infographics
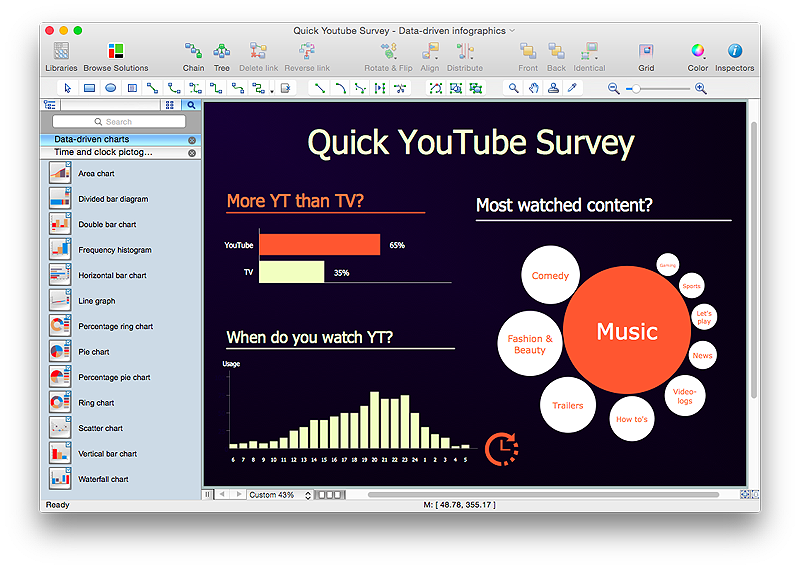
Data-driven infographics are used in wildly disparate areas of business and commerce. To make effective Data-driven infographics, it's useful to have a wide variety of graphical elements — icons, clipart, stencils, charts and graphs — to illustrate your diagram. ConceptDraw Data-driven Infographics solution provides all the tools you need to present data as described by this article — as well as the charts mentioned previously, you can find histograms, divided bar charts, ring charts, line graphs and area charts — meaning you can find the perfect medium for displaying a certain type of data. It allows you to draw data driven infographics quickly and easily using the special templates and vector stencils libraries.It can be used to quickly communicate a message, to simplify the presentation of large amounts of data, to see data patterns and relationships, and to monitor changes in variables over time.HelpDesk
How To Create a MS Visio Cross-Functional Flowchart Using ConceptDraw PRO
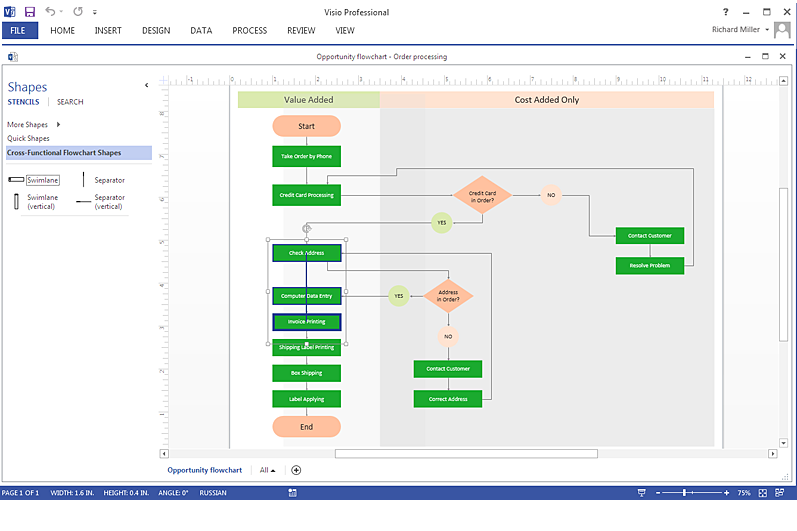
Cross-functional is a process involving several functional layers. Such processes typically cause the most problems, and therefore, is the most potential for improvement. Cross-functional business processes are usually illustrate the processes of product development, commercial proposal development, the order execution process - everything, that involves several departments. The package of possible improvements - is the task of re-engineering. To illustrate the cross-functional processes often use cross-functional flowchart is often used to illustrate the cross-functional processes. ConceptDraw PRO allows you to easily create cross-functional flowchart. Then, you can export it to MS Visio VSDX or VDX format and successfully share it with your colleagues still using MS Visio.- Engineering Drawing Basics Ppt
- Engineering Drawing Symbols Ppt
- How To Draw Block Diagram In Microsoft Powerpoint
- Industrial Drawing Sample Pdf
- Mechanical Drawing Symbols | Mechanical Design Software ...
- Export Conceptdraw Document To Pdf
- Export from ConceptDraw PRO Document to PPT or PPTX ( MS
- Technical Drawing Software | Mechanical Drawing Symbols ...
- Mechanical Engineering Drawing Symbols Ppt
- Mechanical Engineering | Mechanical Drawing Symbols | CAD ...
- Process Flowchart | Mechanical Drawing Symbols | Types of ...
- Mechanical Design Software | Technical Drawing Software ...
- Mechanical Engineering | Technical Drawing Software | Engineering ...
- Bubble Diagrams | How to Add a Bubble Diagram to a PowerPoint ...
- Powerpoint Draw Chemistry
- ConceptDraw PRO Compatibility with MS Visio | Electrical Symbols ...
- Bubble Diagrams | How to Add a Bubble Diagram to a PowerPoint ...
- Residential Plumbing Plan Drawings
- Export from ConceptDraw PRO Document to SWF (Adobe® Flash ...
- Conversion Pdf En Ppt


