This site uses cookies. By continuing to browse the ConceptDraw site you are agreeing to our Use of Site Cookies.

Basic Diagramming

Mathematics is an exact science, which studies the values, spatial forms and quantitative relations. It is a science, in which is built large number of various diagrams, charts and graphs that present the material in a clear, visual and colorful form, help to analyze the information and to make certain conclusions. A diagram is a graphical representation of data using the linear segments or geometric shapes, which allows to evaluate the ratio of several values. Depending on the types of solved tasks are used the diagrams of different kinds. A graph is a diagram that shows quantitative dependencies of various processes using the curves. ConceptDraw DIAGRAM is a powerful intelligent and multifunctional vector engine for drawing different Mathematical diagrams and graphs, Mathematical illustrations, complex and simple Diagram mathematics, Flowcharts of equation solving process, Line graphs, Scatter plots, Histograms, Block diagrams, Bar charts, Divided bar diagrams, Pie charts, Area charts, Circular arrows diagrams, Venn diagrams, Bubble diagrams, Concept maps, and many others.

Bar Diagram Math

ConceptDraw DIAGRAM extended with Divided Bar Diagrams solution from Graphs and Charts area of ConceptDraw Solution Park is the best software for quick and simple drawing the Divided Bar Diagrams and Bar Diagram Math.

Mathematics Symbols

ConceptDraw DIAGRAM extended with Mathematics solution from the Science and Education area is a powerful diagramming and vector drawing software that offers all needed tools for mathematical diagrams designing. Mathematics solution provides 3 libraries with predesigned vector mathematics symbols and figures: Solid Geometry Library, Plane Geometry Library and Trigonometric Functions Library.

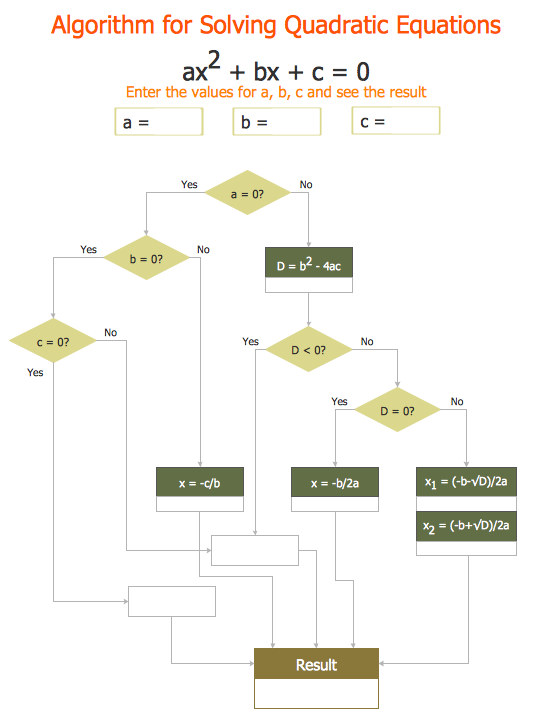
Mathematical Diagrams

ConceptDraw DIAGRAM diagramming and vector drawing software extended with Mathematics solution from the Science and Education area is the best for creating: mathematical diagrams, graphics, tape diagrams various mathematical illustrations of any complexity quick and easy. Mathematics solution provides 3 libraries: Plane Geometry Library, Solid Geometry Library, Trigonometric Functions Library.

Simple Drawing Applications for Mac

ConceptDraw gives the ability to draw simple diagrams like flowcharts, block diagrams, bar charts, histograms, pie charts, divided bar diagrams, line graphs, area charts, scatter plots, circular arrows diagrams, Venn diagrams, bubble diagrams, concept maps, and others.

mathematical diagrams, mathematical symbols, tape diagrams Mathematics

mathematical diagrams, mathematical symbols, tape diagrams
Mathematics solution extends ConceptDraw DIAGRAM software with templates, samples and libraries of vector stencils for drawing the mathematical illustrations, diagrams and charts.

The Best Mac Software for Diagramming or Drawing

ConceptDraw DIAGRAM is a powerful intelligent vector graphics engine that can be used to create basic diagrams including flowcharts, charts, workflows, flowcharts, organizational charts, business diagram, learn business diagrams, flow diagrams.
How to draw an Organizational Chart

Best Multi-Platform Diagram Software

ConceptDraw DIAGRAM is a powerful tool for drawing business communication ideas and concepts, simple visual presentation of numerical data in the Mac environment.

The Best Choice for Creating Diagram

Download ConceptDraw diagram software for easy drawing.

Scatter Graph Charting Software

ConceptDraw provides some interactive xy chart and scatter graph symbols that offers advanced features yet is simple to use.