HelpDesk
How to Draw a Chemical Process Flow Diagram
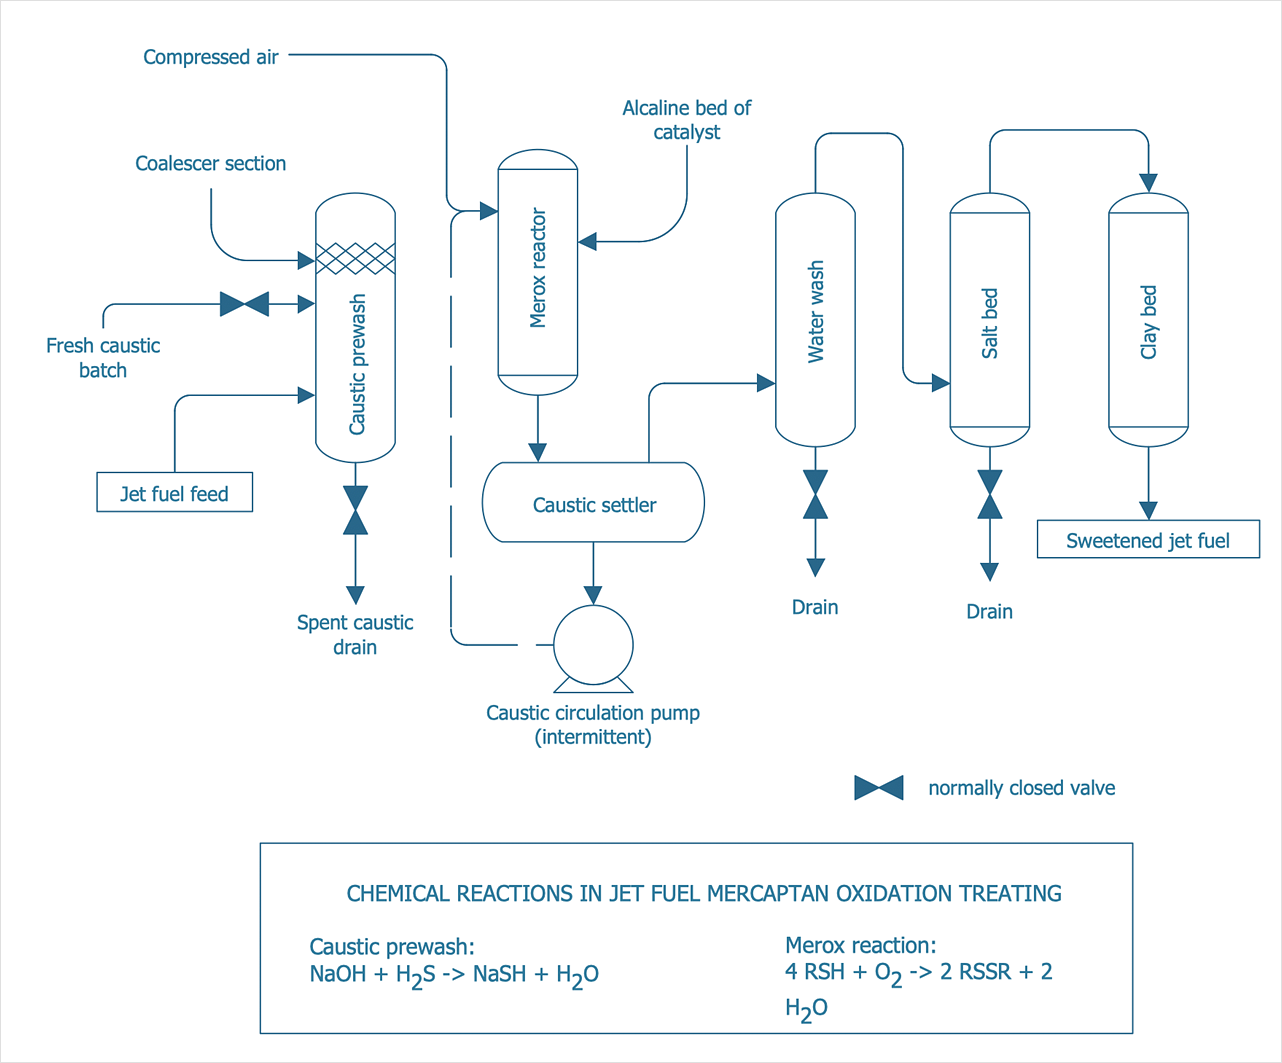
Process Flow Diagram widely used in modeling of processes in the chemical industry. A Chemical Process Flow diagram (PFD) is a specialized type of flowchart. With the help of Chemical Process Flow Diagram engineers can easily specify the general scheme of the processes and chemical plant equipment. Chemical Process Flow Diagram displays the real scheme of the chemical process, the relationship between the equipment and the technical characteristics of the process. Chemical Process Flow Diagram illustrates the connections between the basic equipment as well as the overall structure of pipelines and other supporting equipment. The purpose of the PFD is to build the image of the basic idea of the chemical process. ConceptDraw DIAGRAM together with its Chemical and Process Engineering solution delivers the possibility to design Chemical Process Flow diagrams. It is designed for chemical industry engineers and designers.
 Chemical and Process Engineering
This chemical engineering solution extends ConceptDraw DIAGRAM.9.5 (or later) with process flow diagram symbols, samples, process diagrams templates and libraries of design elements for creating process and instrumentation diagrams, block flow diagrams (BFD
 Fishbone Diagrams
The Fishbone Diagrams solution extends ConceptDraw DIAGRAM software with the ability to easily draw the Fishbone Diagrams (Ishikawa Diagrams) to clearly see the cause and effect analysis and also problem solving. The vector graphic diagrams produced using this solution can be used in whitepapers, presentations, datasheets, posters, and published technical material.
Bubble diagrams in Landscape Design with ConceptDraw DIAGRAM
Bubble Diagrams are the charts with a bubble presentation of data with obligatory consideration of bubble's sizes. They are analogs of Mind Maps and find their application at many fields, and even in landscape design. At this case the bubbles are applied to illustrate the arrangement of different areas of future landscape design, such as lawns, flowerbeds, playgrounds, pools, recreation areas, etc. Bubble Diagram helps to see instantly the whole project, it is easy for design and quite informative, in most cases it reflects all needed information. Often Bubble Diagram is used as a draft for the future landscape project, on the first stage of its design, and in case of approval of chosen design concept is created advanced detailed landscape plan with specification of plants and used materials. Creation of Bubble Diagrams for landscape in ConceptDraw DIAGRAM software is an easy task thanks to the Bubble Diagrams solution from "Diagrams" area. You can use the ready scanned location plan as the base or create it easy using the special ConceptDraw libraries and templates.Software development with ConceptDraw DIAGRAM
Modern software development requires creation of large amount of graphic documentation, these are the diagrams describing the work of applications in various notations and cuts, also GUI design and documentation on project management. ConceptDraw DIAGRAM technical and business graphics application possesses powerful tools for software development and designing technical documentation for object-oriented projects. Solutions included to the Software Development area of ConceptDraw Solution Park provide the specialists with possibility easily and quickly create graphic documentation. They deliver effective help in drawing thanks to the included package of templates, samples, examples, and libraries with numerous ready-to-use vector objects that allow easily design class hierarchies, object hierarchies, visual object-oriented designs, flowcharts, GUI designs, database designs, visualize the data with use of the most popular notations, including the UML and Booch notations, easy manage the development projects, automate projection and development.
 Seven Basic Tools of Quality
Manage quality control in the workplace, using fishbone diagrams, flowcharts, Pareto charts and histograms, provided by the Seven Basic Tools of Quality solution.
- Process Flow Diagram Symbols | How to Create a Mechanical ...
- Process Flow Diagram Symbols | Process Flowchart | Block Diagram ...
- Process Flow Diagram Symbols | Process Flowchart | Basic ...
- Process Flow Diagram Symbols | Process Flowchart | Mechanical ...
- Mechanical Flow Sheet Diagram
- Mechanical Flow Sheet On Drawing Sheet
- Process Flowchart | Process Flow Diagram Symbols | How to Draw a ...
- Process Flowchart | Types of Flowcharts | Process Flow Diagram ...
- Mechanical Drawing Symbols | Process Flow Diagram Symbols ...
- Process Flow Diagram Symbols | Process Flowchart | Making ...
- Process Flowchart | Making Mechanical Diagram | Process Flow ...
- Process Flow Diagram | Process Flow Chart | Process Flowchart ...
- Process Flow Diagram Symbols | Process Flowchart | Mechanical ...
- Draw Diagram Of Water Flow System
- Process Flowchart | Process Flow Diagram Symbols | Types of ...
- Process Flow Diagram Symbols | Process Flowchart | Electrical ...
- Process Flow Diagram Symbols | Process Flow Diagram | Energy ...
- Process Flow Diagram Symbols | Process Flowchart | How to Draw a ...
- Mechanical Drawing Symbols | Process Flow Diagram Symbols ...


