Process Flowchart
The main reason of using Process Flowchart or PFD is to show relations between major parts of the system. Process Flowcharts are used in process engineering and chemical industry where there is a requirement of depicting relationships between major components only and not include minor parts. Process Flowcharts for single unit or multiple units differ in their structure and implementation. ConceptDraw PRO is Professional business process mapping software for making Process flowcharts, Process flow diagram, Workflow diagram, flowcharts and technical illustrations for business documents and also comprehensive visio for mac application. Easier define and document basic work and data flows, financial, production and quality management processes to increase efficiency of your business with ConcepDraw PRO. Business process mapping software with Flowchart Maker ConceptDraw PRO includes extensive drawing tools, rich examples and templates, process flowchart symbols and shape libraries, smart connectors that allow you create the flowcharts of complex processes, process flow diagrams, procedures and information exchange. Process Flowchart Solution is project management workflow tools which is part ConceptDraw Project marketing project management software. Drawing charts, diagrams, and network layouts has long been the monopoly of Microsoft Visio, making Mac users to struggle when needing such visio alternative like visio for mac, it requires only to view features, make a minor edit to, or print a diagram or chart. Thankfully to MS Visio alternative like ConceptDraw PRO software, this is cross-platform charting and business process management tool, now visio alternative for making sort of visio diagram is not a problem anymore however many people still name it business process visio tools.
Basic Audit Flowchart. Flowchart Examples
This sample shows the Audit Process Flowchart. It was created in ConceptDraw PRO diagramming and vector drawing software using the Flowcharts solution from the Diagrams area of ConceptDraw Solution Park. The Audit Flowcharts are widely used in the financial management, accounting, money management and in many others fields.Mechanical Engineering
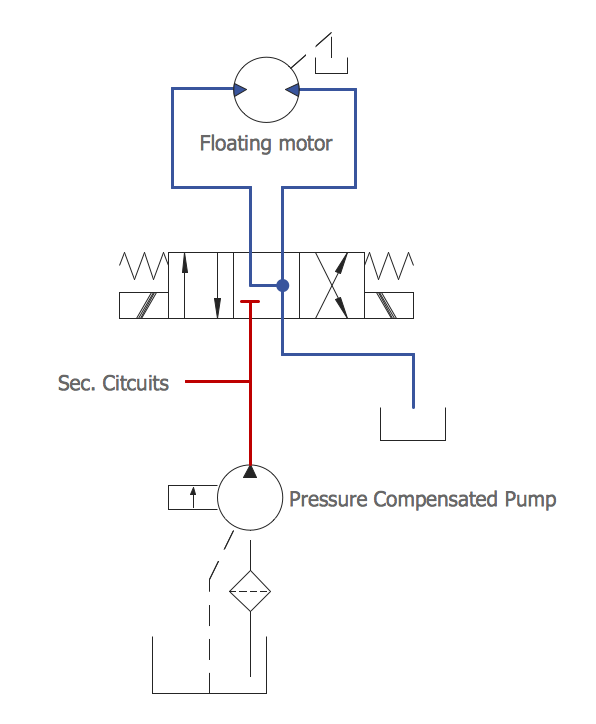
ConceptDraw PRO is the best diagramming and vector drawing software. Now, enhanced with Mechanical Engineering solution from the Engineering area of ConceptDraw Solution Park it became ideal for creating: Technical Mechanical Drawings, Mechanical Engineering Diagrams, Pneumatic Schematics, Hydraulic Schemes, etc.Mechanical Drawing Symbols
Mechanical Drawings are the special type of technical diagrams that visualize the structure of complex systems and illustrate the information about ventilation, heating, air conditioning, i.e. HVAC systems. These drawings are created on the base of floor plans and reflected ceiling plans, and then become an obligatory part of construction project which is needed directly for construction a building and for receiving a permit on it. Mechanical drawings and diagrams help effectively represent construction, technical and engineering solutions, and also schematics of different mechanical equipment. ConceptDraw PRO vector drawing software enhanced with Mechanical Engineering solution from Engineering area of ConceptDraw Solution Park provides wide set of effective drawing tools, predesigned mechanical drawing symbols, templates, samples and examples. Use of standardized and recognized mechanical vector symbols helps you design understandable mechanical drawings, diagrams and mechanical engineering schematics.Samples of Flowchart
This sample shows the Flowchart of the testing the work of the lamp and decision making about what to do to lamp will work.Flow Diagram Software
The diagram is a convenient way of representing complex information and data in a simple, visual and comprehensive form. There are used many types of diagrams, each of them has its own fields of application. Flow diagram is a diagram that illustrates the flow or set of dynamic relationships in a system, visually depicts the structure of the elements in a complex system and their interactions. The term Flow diagram is also synonym for a Flowchart. Flow Diagrams are the perfect way to visually represent the structural data. ConceptDraw PRO extended with Flowcharts solution from the Diagrams area is a professional flow diagram software. The basic set of vector stencils libraries offered by Flowcharts solution, variety of samples and templates developed by specialists, and also advanced RapidDraw technology open before ConceptDraw users wide opportunities in representing the flow processes, in drawing Flow Diagrams and Flowcharts of any type and complexity. Easy tools of exporting to different graphical formats give the possibility of further successful use the diagrams.
 Cross-Functional Flowcharts
Cross-functional flowcharts are powerful and useful tool for visualizing and analyzing complex business processes which requires involvement of multiple people, teams or even departments. They let clearly represent a sequence of the process steps, the order of operations, relationships between processes and responsible functional units (such as departments or positions).
CAD Drawing Software for Making Mechanic Diagram and Electrical Diagram Architectural Designs
Computer-aided design (CAD) is an automated organizational-technical system that implements the information technology of execution the functions of design. It consists of staff and complex of technical, software and other means of automation designing process. CAD is used for improvement design quality and designer's productivity. Computer-aided design is actively applied in many fields, such as industrial and mechanical design, automotive, aerospace, and shipbuilding industries, in designing electrical diagrams for electronic systems and architectural design, in manufacturing for creation the databases. СonceptDraw PRO is a powerful and effective CAD drawing software for making Mechanic Diagram and Electrical Diagram Architectural Designs. CAD diagrams and designs of any complexity created with ConceptDraw PRO are vector graphic documents, which can be easy converted to a variety of formats (image, HTML, PDF file, MS PowerPoint Presentation, Adobe Flash or MS Visio XML) for further successful using in presentations and reports.
Building Drawing Design Element: Piping Plan
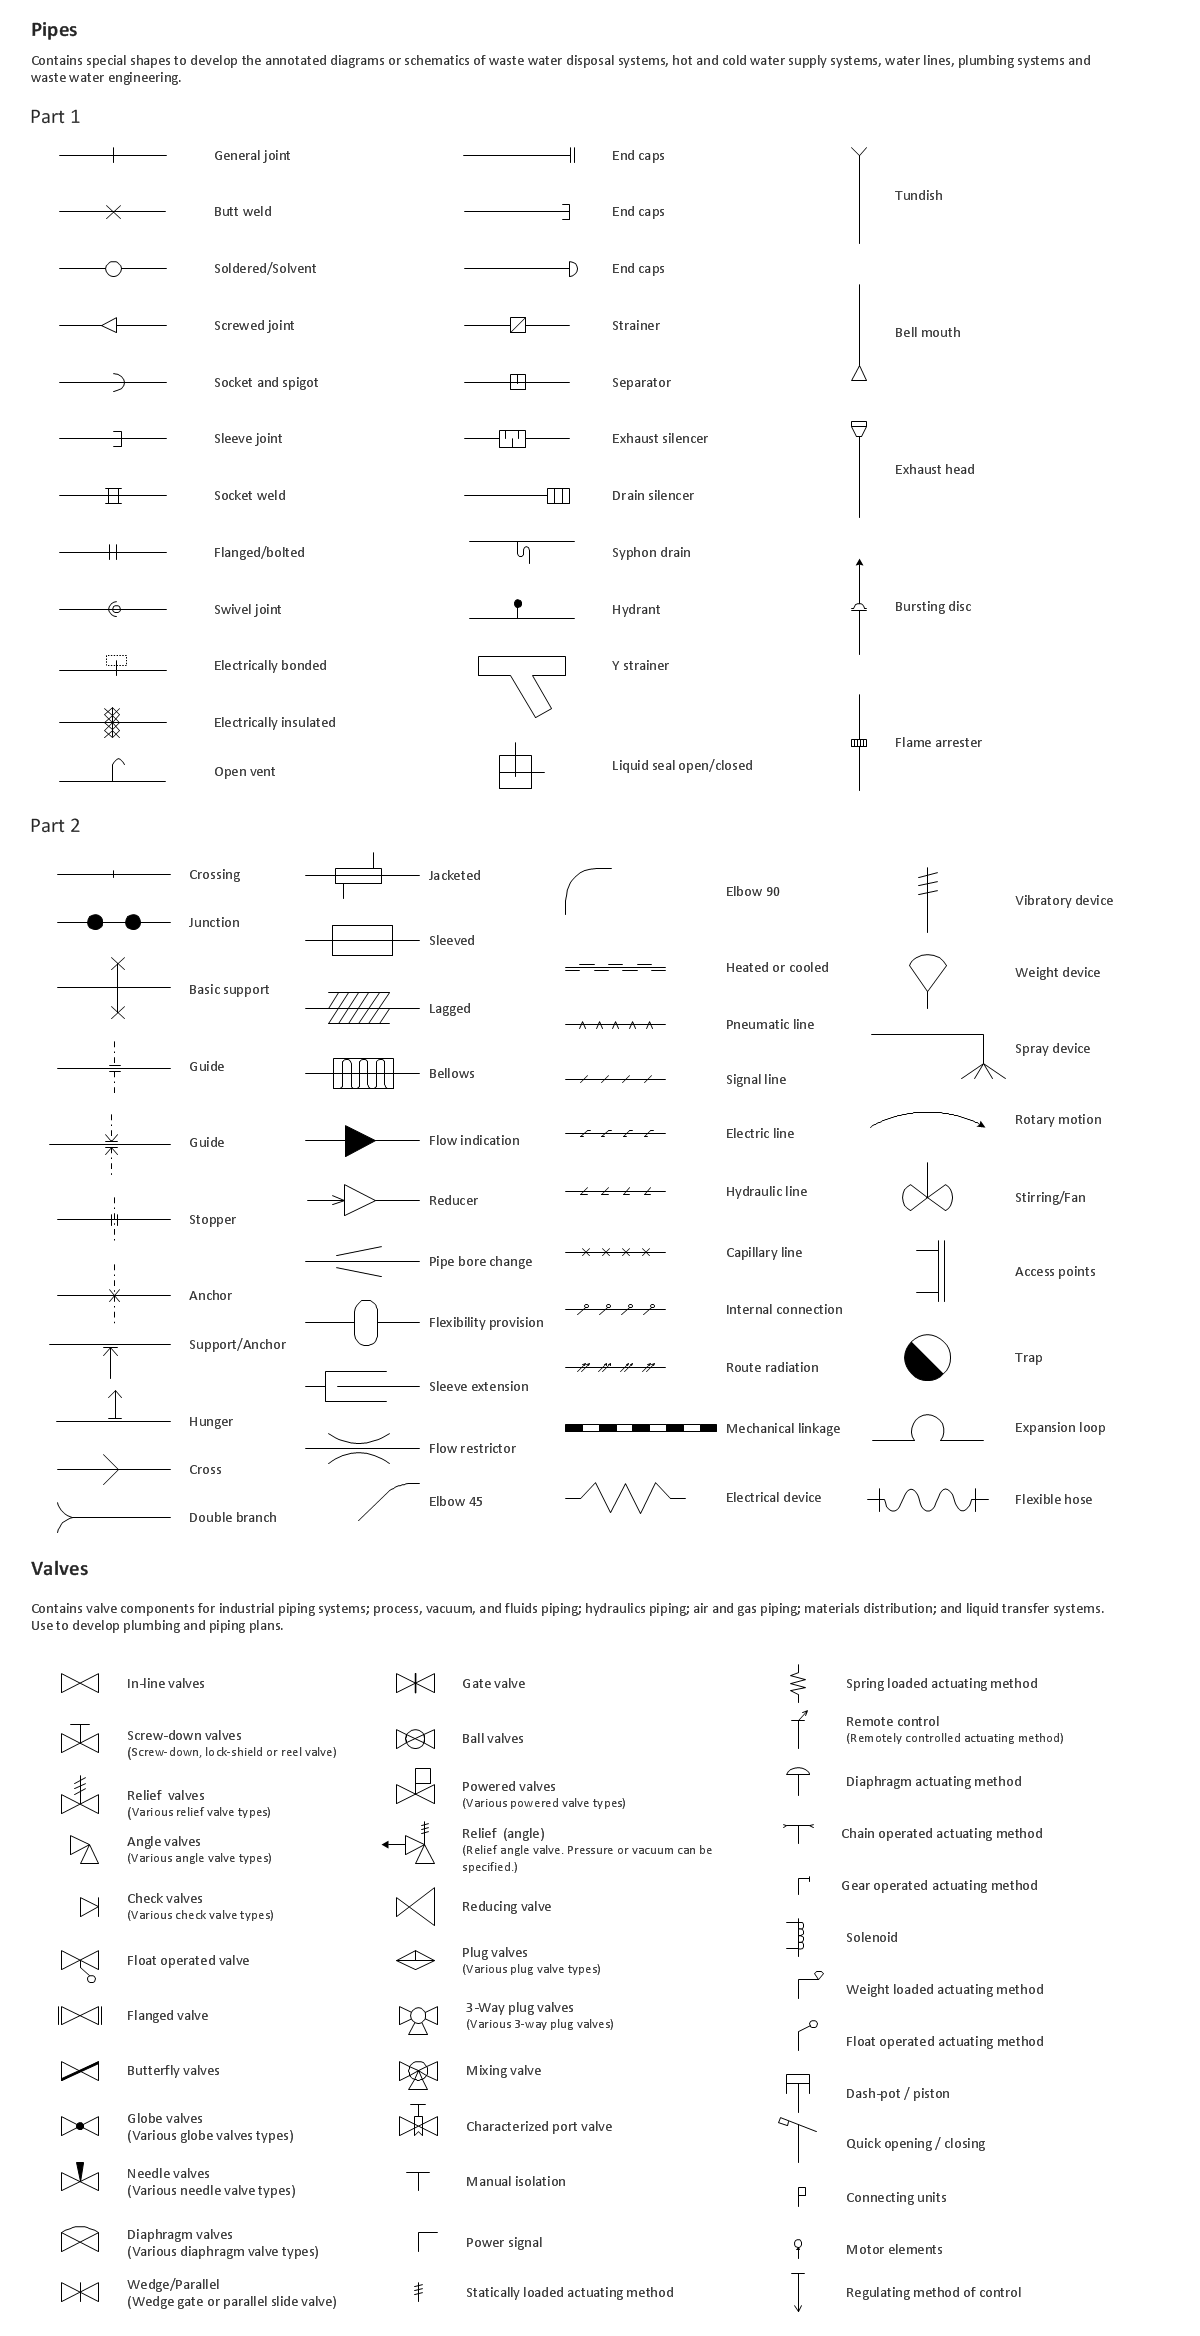
When you are going to build a house or to make repairs of new built home, apartment, office, shop, or to renovate any other premises, in many cases you will need to make the package of drawings, plans and documents, including the such important plans as the Overall floor plan, Interior design plan, Ceiling plan, Electrical system plan, and of course the Plumbing plan, Water supply system plan, and Piping Plan. When choosing between the modern software for building construction, planning and design, we recommend you to select the multifunctional building plan software ConceptDraw PRO enhanced with Plumbing and Piping Plans solution from the Building Plans area of ConceptDraw Solution Park. This solution provides large variety of examples, samples, quick-start templates and libraries of pipes, plumbing and valves vector design elements for design and construction the Plumbing and Piping Plans, schematics and annotated diagrams for hot and cold water supply systems, water lines and waste water disposal systems.
Sample Project Flowchart. Flowchart Examples
This sample shows the Flowchart that displays the architecture of SQL Exception Translation. This sample was created in ConceptDraw PRO diagramming and vector drawing software using the Flowcharts solution from the Diagrams area of ConceptDraw Solution Park.
Value Stream Mapping Symbols
VSM symbols are the best for a production process designing. The entire Value Stream Mapping method uses a graphical representation of the manufacturing process, factors' pros and cons, that all stakeholders can easily understand. Value Stream Mapping is a graphical technique that provides possibilities to improve analysis of a manufacturing process, at the stage of the transferring information or materials that required to deliver a product or service to the customer.The Action Plan
Action Plan - For the action planning define people and groups involvement in corrective actions by roles, identify logical sequences of scheduled actions and critical path of problem solving, identify possible risks of action plan and propose preventive actions. ConceptDraw Office suite is a software for decision making and action plan.
Line Graph Charting Software
To design line and scatter charts use ConceptDraw PRO diagramming and vector drawing software extended with Line Graphs solution from Graphs and Charts area of ConceptDraw PRO Solution Park. (Line chart, scatter chart, 2d chart).Cause and Effect Analysis
Cause and Effect Analysis - The Seven Management and Planning Tools is a tool for Cause and Effect Analysis that allows users to analyze the root causes for factors that influenced the problem. This diagram is constructed separately for each highly prioritized factor. The Diagram is then used for further formulation of potential actions.
 Engineering
This solution extends ConceptDraw PRO v9.4 with the ability to visualize industrial systems in electronics, electrical, chemical, process, and mechanical engineering.
- Process Flowchart | Mechanical Drawing Symbols | ERD Symbols ...
- Process Flowchart | Mechanical Drawing Symbols | Basic Flowchart ...
- Quality Department In Use Mechanical Symbol
- Process Flowchart | Mechanical Drawing Symbols | Basic Flowchart ...
- Mechanical Drawing Symbols | Network Printer | Process Flowchart ...
- Mechanical Drawing Symbols | Process Flowchart | Basic Flowchart ...
- Mechanical Related Quality Control Symbols And Their Meaning In ...
- Mechanical Drawing Symbols | Process Flowchart | CAD Drawing ...
- Quality Control Symbol Mechanical
- Mechanical Drawing Symbols | Process Flowchart | Mechanical ...
- Mechanical Drawing Symbols | Process Flowchart | Basic Flowchart ...
- Mechanical Drawing Symbols | Process Flowchart | Mechanical ...
- Process Flowchart | Basic Flowchart Symbols and Meaning ...
- Basic Flowchart Symbols and Meaning | Process Flowchart ...
- Process Flowchart | Value Stream Mapping Symbols | Mechanical ...
- Mechanical Drawing Symbols | Process Flowchart | CAD Drawing ...
- Mechanical Engineering Quality Symbol
- Process Flowchart | Mechanical Engineering | Design elements ...
- Mechanical Drawing Symbols | Value Stream Mapping Symbols ...
- Mechanical Drawing Symbols | Process Flowchart | CAD Drawing ...


