Audit Flowchart Symbols
The audit is a complex process consisting of defined quantity of steps, which have as a final goal the ensuring of success of a certain business project. It includes the independent examination of data, statements and financial performances of an enterprise for a stated purpose. It is convenient to construct the Audit Flowcharts or Audit Diagrams for visual representation and structuring the audit processes. ConceptDraw PRO diagramming software enhanced with Audit Flowcharts solution from the Finance and Accounting area of ConceptDraw Solution Park effectively helps to draw the Audit Diagrams for accounting, finance and money management, the Audit Flowcharts for fiscal information tracking, financial inventories and documenting Six Sigma, the decision making Flow Charts, etc. This solution provides the powerful drawing tools, numerous templates and samples, and large quantity of vector audit flowchart symbols that greatly facilitate the process of representation the audit steps and audit results, and designing efficient and visually appealing Audit Flowcharts.DFD Flowchart Symbols
A Data Flow Diagram (DFD) is a graphical technique which allows effectively model and analyze the information processes and systems. The ability to fast and easy create the DFDs is made possible with Data Flow Diagrams solution from the Software Development area of ConceptDraw Solution Park. For designing the Data Flow Diagrams are used simple DFD flowchart symbols which are connected each other by arrows depicting the data flow from one step to another.Types of Flowchart - Overview
When designing a process or an instruction in clear and understandable way, you should consider creating a flowchart. You can avoid spending a lot of time understanding complex concepts as they get clear with different diagrams. The flowcharts are very popular diagram type, they are useful at different fields from the description business processes to the presentation of cooking recipes. Basic Flowchart, Business Process Modeling Diagram, Process Flowchart, Cross Functional Flowchart, Procedure Flowchart, Data Flow Diagram, IDEF Flowchart, SDL Diagram, Workflow Diagram, Document Flowchart, Program Flowchart, Value Stream Map, System Flowchart, Highlight Flowchart, Sales Flowchart are the main types flowchart. The ConceptDraw PRO is one of the professional applications which has great advantages and using which you can create different types of Flowcharts easy and fast. Try to draw an illustrative and comprehensible diagram in ConceptDraw PRO describing the processes instead of writing complex long text and make sure how it is convenient. Visio is expensive, and if you use it in a team environment, these costs are compounded. ConceptDraw PRO is an affordable alternative to Visio and luckily, it comes with a team plan. ConceptDraw PRO can import and export Visio files, so Mac users can collaborate with PC users stuck on Microsoft's software.
Diagramming Software for Design UML Collaboration Diagrams
ConceptDraw helps you to start designing your own UML Collaboration Diagrams with examples and templates.
Work Flow Chart
What is a Work Flow Chart? It is a chart which visually displays the step-by-step transferring of data, documents and tasks during the work. ConceptDraw PRO extended with Workflow Diagrams solution from the Business Processes area of ConceptDraw Solution Park is the best software for drawing the Work Flow Chart of any complexity.Garrett IA Diagrams with ConceptDraw PRO
Garrett IA diagrams are used at development of Internet-resources, in particulars at projecting of interactions of web-resource elements. The diagram of information architecture of the web resource which is constructed correctly with necessary details presents to developers the resource in comprehensible and visual way.Data Flow Diagram Software
Data Flow Diagrams (DFDs) are successfully used when studying the business processes or systems that involve the transfer of data. They are a visual way to represent the data processing, to model and visualize the flow of data through a computer system and functional requirements for a designed system. They are the good business modeling tool to describe the business events and interactions, the physical systems involving the storage and transfer of data. ConceptDraw PRO supplied with Data Flow Diagrams solution from Software Development area of ConceptDraw Solution Park is a modern and powerful data flow diagram software. This solution offers large set of predesigned DFD vector objects, grouped to three libraries: Data Flow Diagrams, Gane-Sarson Notation, and Yourdon and Coad Notation. All they and also collection of DFD samples and built-in templates make a good base for ConceptDraw PRO users, providing them all conditions for easy creation the Data Flow Diagrams and Data Flow Models of any complexity.Netflow architecture. Computer and Network Examples
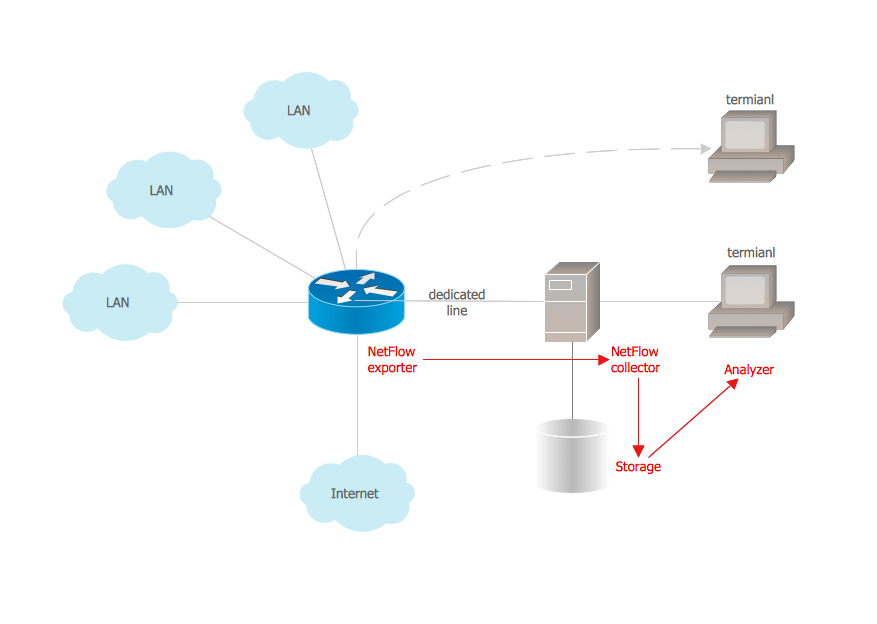
Netflow is a network protocol used for accounting the IP network traffic. It was developed by Cisco Systems. Now it is actually the industrial standard, it is supported by many devices. There are several versions of the protocol, but the most common are the versions 5 and 9. This diagram was created in ConceptDraw PRO using the Computer and Networks Area of ConceptDraw Solution Park and shows the Netflow architecture.
- Invoice payment process - Flowchart | Top 5 Android Flow Chart ...
- Billing Process Flow Chart
- Basic Flowchart Symbols and Meaning | Emergency medical ...
- Medical Claims Process Chart
- Work Order Process Flowchart . Business Process Mapping ...
- Billing Flowchart Example
- Garrett IA Diagrams with ConceptDraw PRO | Payment Billing ...
- Accounting Flowchart Purchasing Receiving Payable and Payment ...
- Invoice payment process - Flowchart | Accounting Flowchart ...


