IDEF3 Standard
Use Case Diagrams technology. IDEF3 Standard is intended for description and further analysis of technological processes of an enterprise. Using IDEF3 standard it is possible to examine and model scenarios of technological processes.Biology Drawing Software
Biology is incredibly interesting and useful natural science which studies all living things on the earth (people, animals, plants), structure, functions, interactions, evolution of living organisms. Biologists of the whole world use actively illustrations and drawings in your science and education activity. To facilitate their task of biology drawing, ConceptDraw DIAGRAM diagramming and vector drawing software was extended with Biology solution from the Science and Education area. Now, ConceptDraw DIAGRAM is a powerful biology drawing software.Data Flow Diagram Software
Data Flow Diagrams (DFDs) are successfully used when studying the business processes or systems that involve the transfer of data. They are a visual way to represent the data processing, to model and visualize the flow of data through a computer system and functional requirements for a designed system. They are the good business modeling tool to describe the business events and interactions, the physical systems involving the storage and transfer of data. ConceptDraw DIAGRAM supplied with Data Flow Diagrams solution from Software Development area of ConceptDraw Solution Park is a modern and powerful data flow diagram software. This solution offers large set of predesigned DFD vector objects, grouped to three libraries: Data Flow Diagrams, Gane-Sarson Notation, and Yourdon and Coad Notation. All they and also collection of DFD samples and built-in templates make a good base for ConceptDraw DIAGRAM users, providing them all conditions for easy creation the Data Flow Diagrams and Data Flow Models of any complexity.Basic Diagramming
Create flowcharts, organizational charts, bar charts, line graphs, and more with ConceptDraw DIAGRAM.
Garrett IA Diagrams with ConceptDraw DIAGRAM
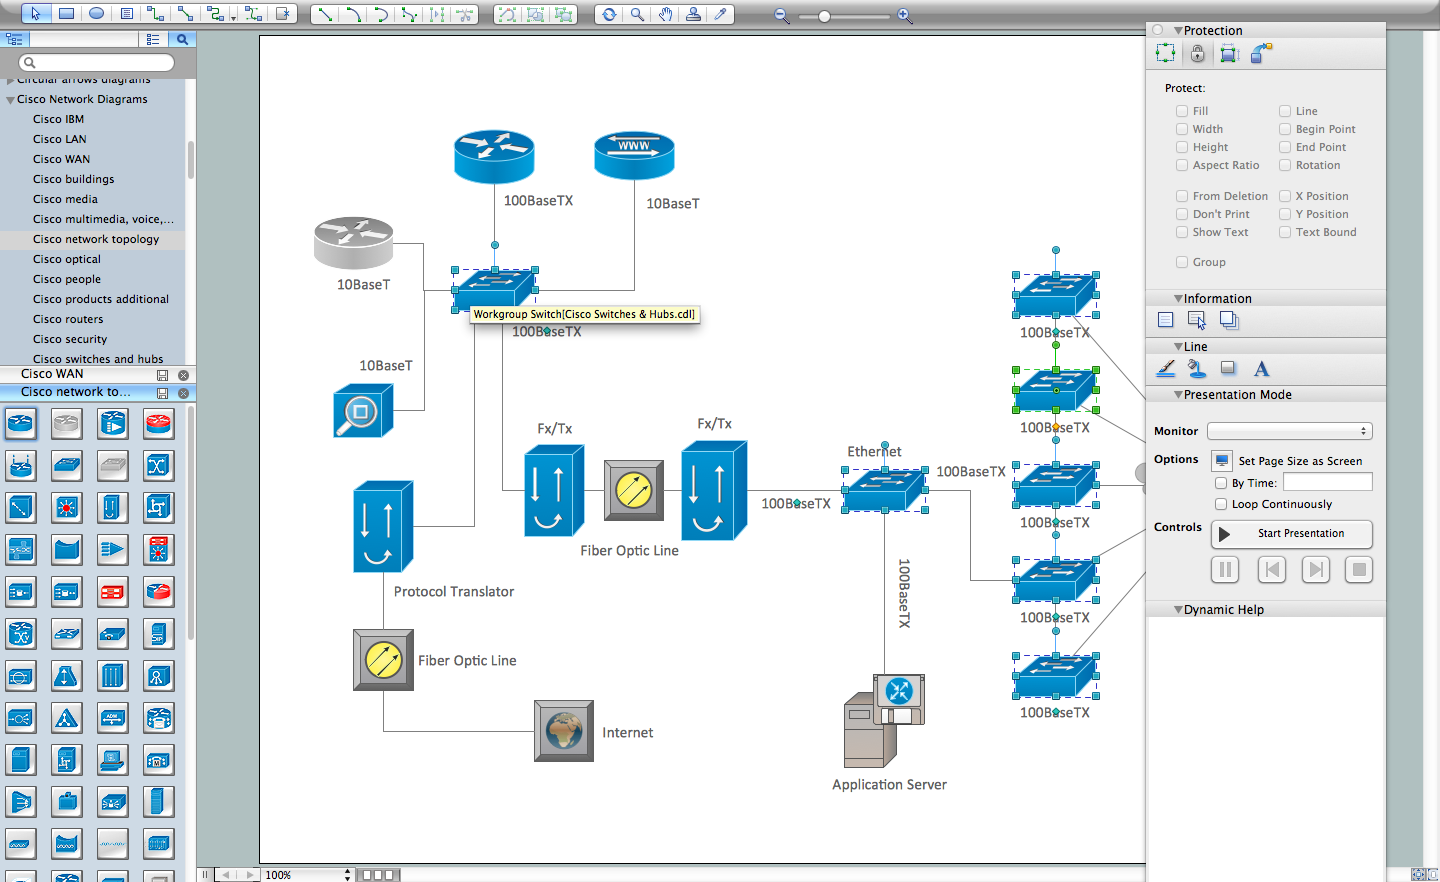
Garrett IA diagrams are used at development of Internet-resources, in particulars at projecting of interactions of web-resource elements. The diagram of information architecture of the web resource which is constructed correctly with necessary details presents to developers the resource in comprehensible and visual way.Cisco Network Diagram Software
ConceptDraw DIAGRAM is the best network diagram software. To design the Cisco Network Diagrams and visualize the computer networks topology use ConceptDraw DIAGRAM diagramming and vector drawing software extended with Cisco Network Diagrams solution for ConceptDraw DIAGRAM Solution Park.UML Diagrams with ConceptDraw DIAGRAM
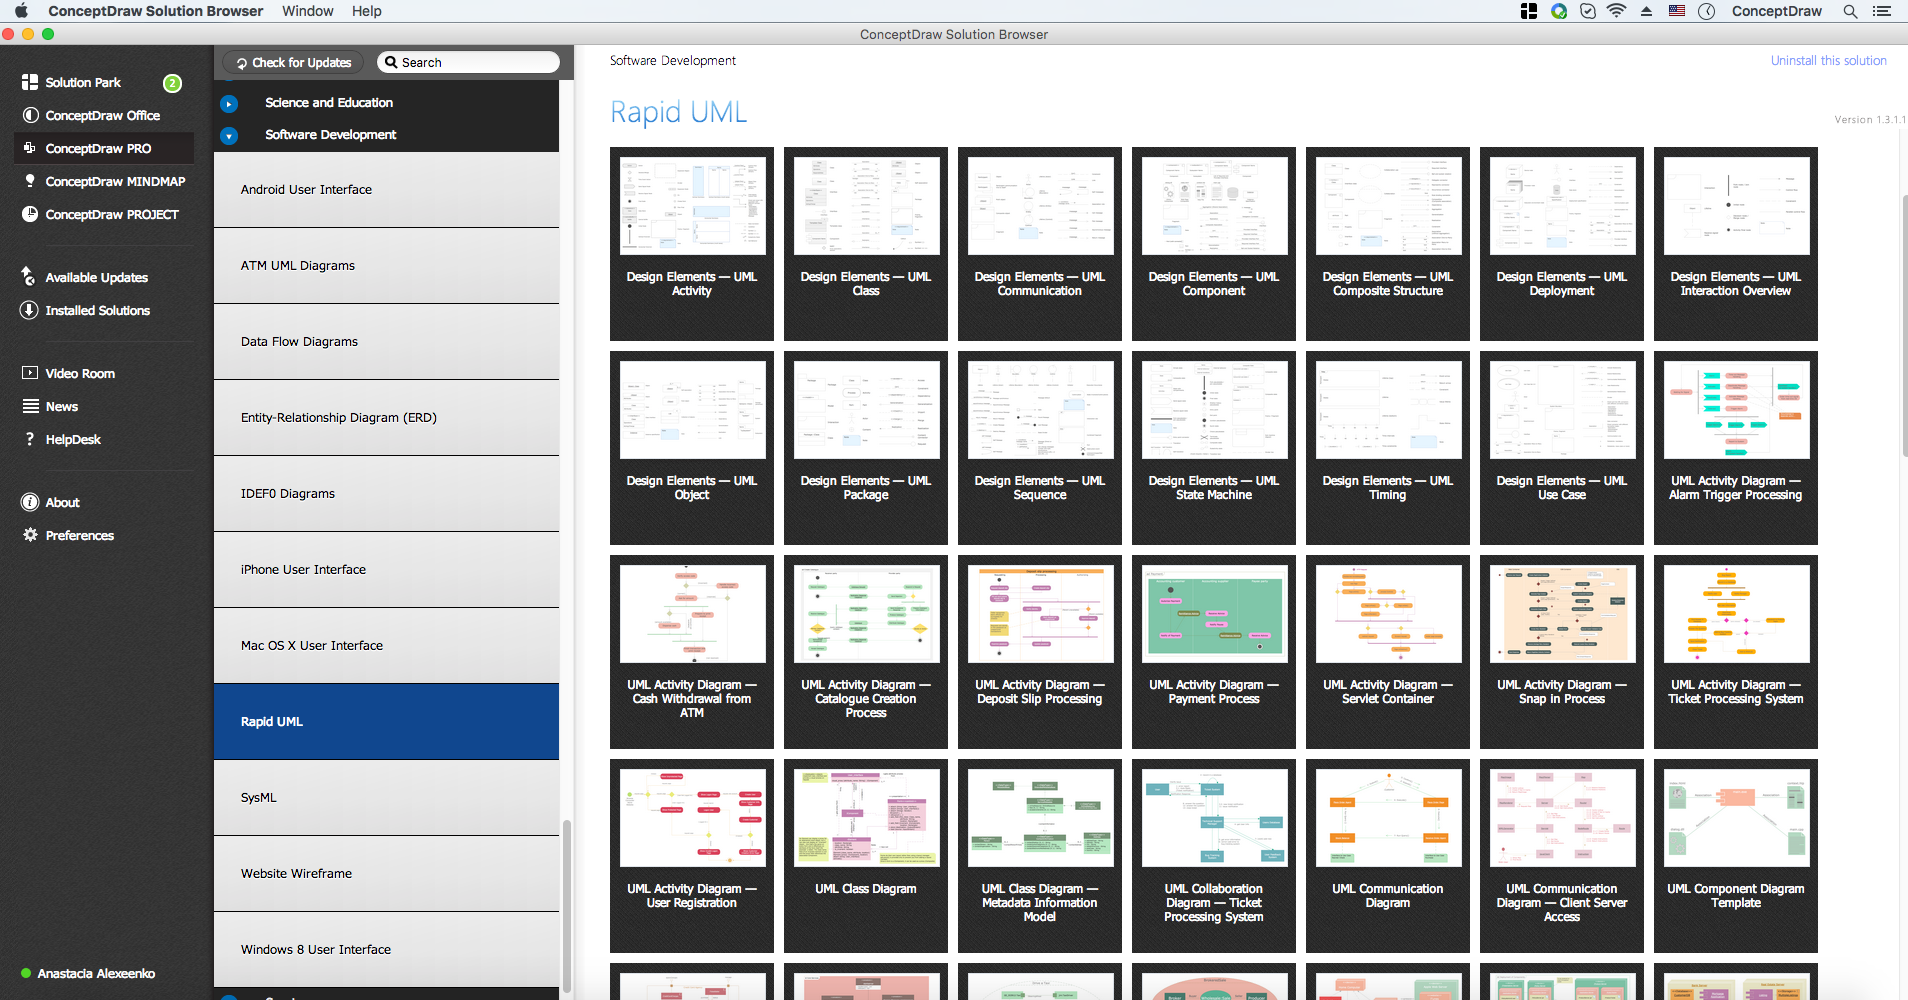
Unified Modeling Language (UML) is a single modeling language that is used in software engineering to represent effectively the structure of complex computer systems and software. Such visual models in form of UML diagrams allow simplify the process of software development, let to meet the deadlines, improve the final software products, and also facilitate communication process between the customer, system analysts and programmers. The UML language defines standards for operations, methods of programming languages, and their terminology. The main types of UML diagrams are: Activity diagram, Use Case diagram, Deployment diagram, Statechart diagram, Class diagram, Component diagram, Sequence diagram, Collaboration diagram. ConceptDraw DIAGRAM extended with Rapid UML solution is a professional software that provides perfect possibility of easy designing detailed UML diagrams. It offers large number of task-oriented templates and predesigned vector stencils that correspond to standard UML diagram notation. Use them to instantly design the UML diagrams.Best Diagramming Software for macOS
ConceptDraw DIAGRAM creates drawings, flowcharts, block diagrams, bar charts, histograms, pie charts, divided bar diagrams, line graphs, area charts, scatter plots, circular arrows diagrams, Venn diagrams, bubble diagrams with great visual appeal on Mac OS X.
Diagramming Software for Design UML Activity Diagrams
Activity diagram describes the business and operational step-by-step workflows of components in a system. An activity diagram shows the overall flow of control.
- IDEF3 Standard | Free Software To Draw Medical Diagrams
- UML Class Diagram Example - Medical Shop | Online Diagram Tool ...
- UML Diagram | UML Class Diagram Example - Medical Shop | UML ...
- UML Class Diagram Example - Medical Shop
- Free Download Use Case Diagram On Medical Store Management
- Draw The Sequence Diagram For Medicine Purchase System
- Activity Diagram For Medical Store Management System
- UML Class Diagram Example - Medical Shop | UML Collaboration ...
- Target Diagram | Bubble Map Maker | Bubble Charts | Econ Graph ...
- UML Class Diagram Example - Medical Shop | UML Class Diagram ...


