Healthcare Management Workflow Diagrams
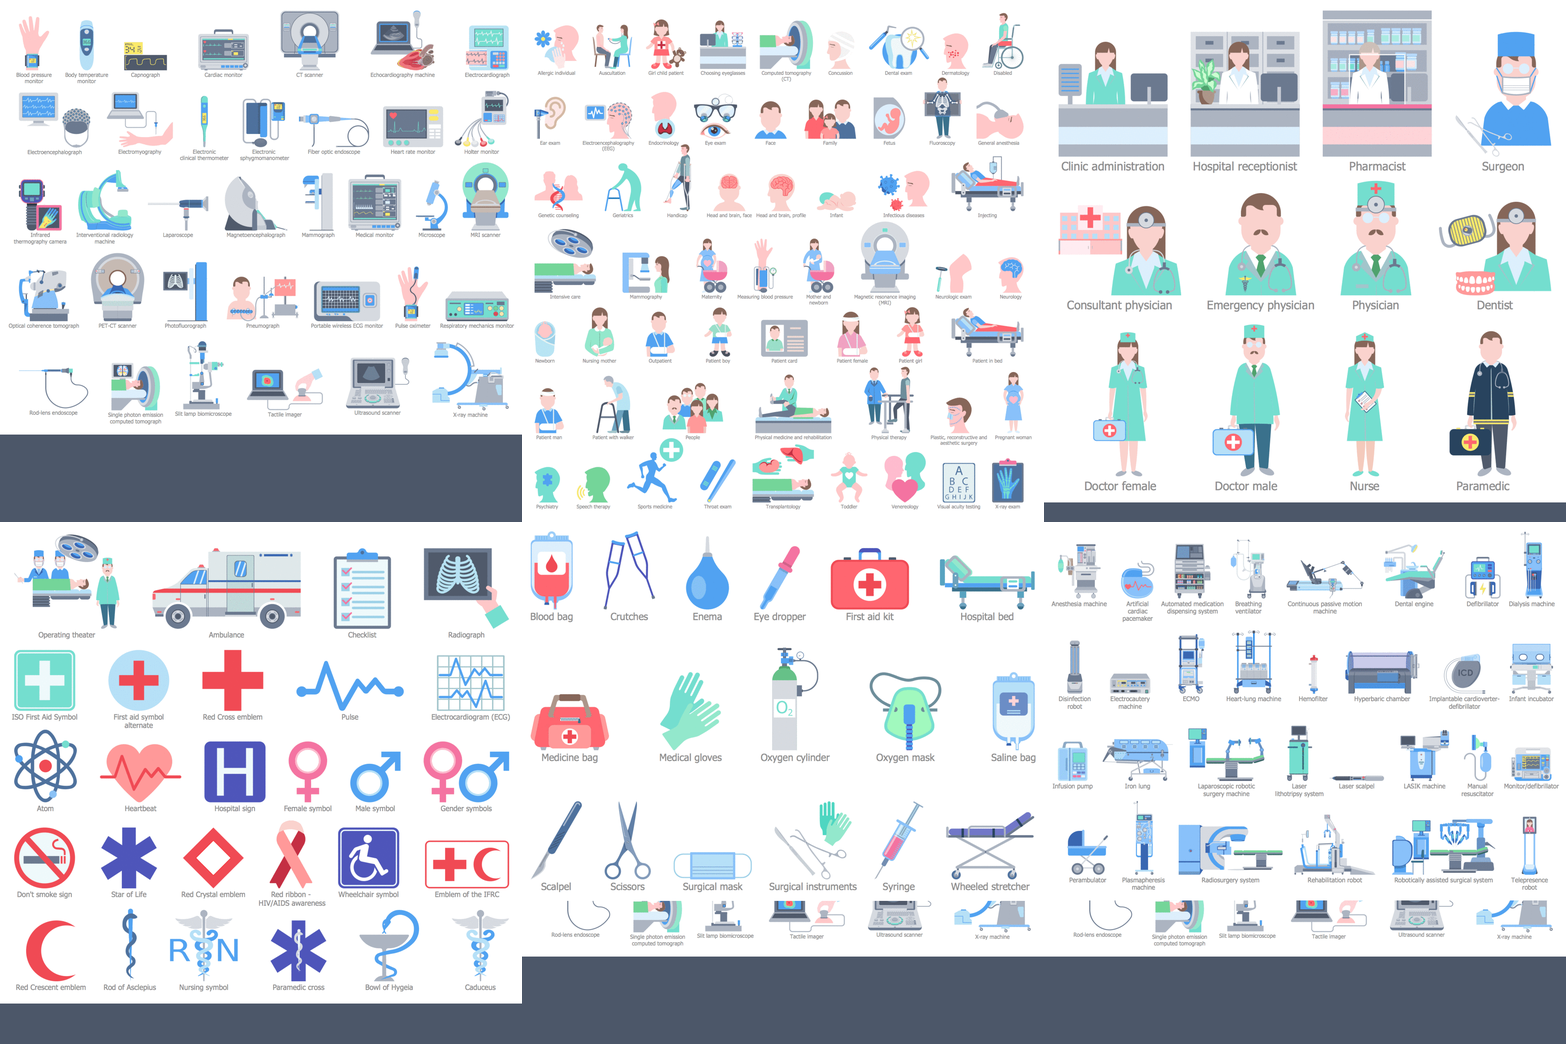
Healthcare Management Workflow Diagrams solution contains large set of colorful samples and libraries with predesigned vector pictograms and symbols of health, healthcare equipment, medical instruments, pharmaceutical tools, transport, medication, departments of healthcare organizations, the medical icons of people and human anatomy, flowchart objects, connectors, and arrows, which make it the best for designing clear and comprehensive Medical Workflow Diagrams and Block Diagrams, Healthcare Management Flowcharts and Infographics, Healthcare Workflow Diagram, for depicting the healthcare workflow and clinical workflows in healthcare, for making the workflow analysis healthcare and healthcare workflow management.
HelpDesk
How to Create a Health Informatics Diagram
The ability to create Health Informatics Workflow diagrams is provided with the ConceptDraw Health Informatics solution. It includes 33 vector graphics icons and 10 sample documents that can be used when representing the flow of data, documents, and tasks during the performance of a health management process.Internal Medicine
Internal medicine is a field of medicine devoted to the study of etiology, also pathogenesis and clinical manifestations of a number of diseases of human internal organs, as well as their prevention, diagnosis and treatment with subsequent rehabilitation. The benefits of use the ConceptDraw ready-made design elements and symbols when drawing medical and health diagrams, infographics and illustrations are obvious. They allow to visualize the generally accepted laws in a given area, as well as innovations, ideas and developments, in a shortest possible interval of time and with minimal efforts.Health Informatics
Health Informatics solution supplies the ConceptDraw DIAGRAM with tools and functionalities in a field of healthcare design and healthcare informatics. Including collection of professionally designed samples and a lot of high-quality health informatics vector design objects, it is the best for all medical workers and healthcare-related specialties when designing diagrams, schematics, flow charts, workflow charts, block diagrams, infographics, illustrations, and presentations slides in a field of Health Informatics, representing the newest medical information technologies, architectures of healthcare systems, principles of work of the specialized software, structures of health records systems, medical researches processes.
This medical flow chart sample depicts plasma donation compatibility path.
It was drawn on the base of Wikimedia Commons file: Plasma donation compatibility path.svg. [commons.wikimedia.org/ wiki/ File:Plasma_ donation_ compatibility_ path.svg]
This file is licensed under the Creative Commons Attribution-Share Alike 3.0 Unported license. [creativecommons.org/ licenses/ by-sa/ 3.0/ deed.en]
"A blood type (also called a blood group) is a classification of blood based on the presence and absence of antibodies and also based on the presence or absence of
inherited antigenic substances on the surface of red blood cells (RBCs). These antigens may be proteins, carbohydrates, glycoproteins, or glycolipids, depending on the blood group system. Some of these antigens are also present on the surface of other types of cells of various tissues. Several of these red blood cell surface antigens can stem from one allele (or an alternative version of a gene) and collectively form a blood group system. Blood types are inherited and represent contributions from both parents. A total of 35 human blood group systems are now recognized by the International Society of Blood Transfusion (ISBT). The two most important ones are ABO and the RhD antigen; they determine someone's blood type (A, B, AB and O, with +, − or Null denoting RhD status)." [Blood type. Wikipedia]
The medical flowchart example "Plasma donation compatibility path" was designed using ConceptDraw PRO software extended with Healthcare Workflow Diagrams solution from Business Processes area of ConceptDraw Solution Park.
UML Class Diagram Example - Medical Shop
State Diagram UML of Online Store. This sample was created in ConceptDraw DIAGRAM diagramming and vector drawing software using the UML Class Diagram library of the Rapid UML Solution from the Software Development area of ConceptDraw Solution Park. This sample shows the work of the medical shop and is used at the creation of the medical shop or pharmacy project, for understanding the process of shopping in the medical shop, for keeping purchases, for medical supplies.Health Package
Health Package is a set of multifaceted solutions intended for visualization and illustration in a field of medicine and health, for drawing colorful, interesting and precise illustrations and infographics that will be used successfully in medical documents, articles, special magazines, posters, billboards, websites, presentations, collages. Having these solutions available, it will not be difficult to illustrate the medical editions, to convey the information in a full and interesting form, to teach students with use effective visual methods, to describe the medical facts, to tell about innovations in a field of medicine, health and correct nutrition, to explain the causes and consequences of different diseases, as well as the measures of their prevention and treatment.
This medical flowchart sample shows assessment and treatment algorithm for overweight and obesity.
It was drawn on the base of Wikimedia Commons file: Assessment and treatment algorithm for overweight and obesity.png. [commons.wikimedia.org/ wiki/ File:Assessment_ and_ treatment_ algorithm_ for_ overweight_ and_ obesity.png]
"A medical algorithm is any computation, formula, statistical survey, nomogram, or look-up table, useful in healthcare. Medical algorithms include decision tree approaches to healthcare treatment (e.g., if symptoms A, B, and C are evident, then use treatment X) and also less clear-cut tools aimed at reducing or defining uncertainty." [Medical algorithm. Wikipedia]
The medical flow chart example "Assessment and treatment algorithm for overweight and obesity" was designed using ConceptDraw PRO software extended with Healthcare Workflow Diagrams solution from Business Processes area of ConceptDraw Solution Park.
HelpDesk
How to Create a Healthcare Management Workflow Diagram
The health and medical workflow diagrams are widespread in medicine to depict the sequence of actions of the medical workers to eliminate particular health problems of the patient. Also drawing is the best way to illustrate processes occurring in the human body. Healthcare Management Workflow Diagrams for ConceptDraw DIAGRAM provides the large set of colorful samples and libraries with predesigned vector pictograms and symbols of health, healthcare equipment, medical instruments, pharmaceutical tools, transport, medication, etc. The Healthcare Management Workflow Diagrams solution found in the Business Processes section of ConceptDraw Solution Park is the best choice for designing clear and comprehensive Medical Workflow Diagrams, Healthcare Management Flowcharts and Infographics.This example was created on the base of QA flowchart from the website of the Health Services Research Unit (HSRU), University of Aberdeen. [abdn.ac.uk/ hsru/ research/ quality/ qa-documents/ ]
"Quality assurance (QA) is a way of preventing mistakes or defects in manufactured products and avoiding problems when delivering solutions or services to customers...
QA is very important in the medical field because it helps to identify the standards of medical equipments and services. Hospitals and laboratories make use of external agencies in order to ensure standards for equipment such as X-ray machines, Diagnostic Radiology and AERB." [Quality assurance. Wikipedia]
The example "Process flowchart - QA processes in HSRU" was created using the ConceptDraw PRO software extended with the Seven Basic Tools of Quality solution from the Quality area of ConceptDraw Solution Park.
Medical Illustrations
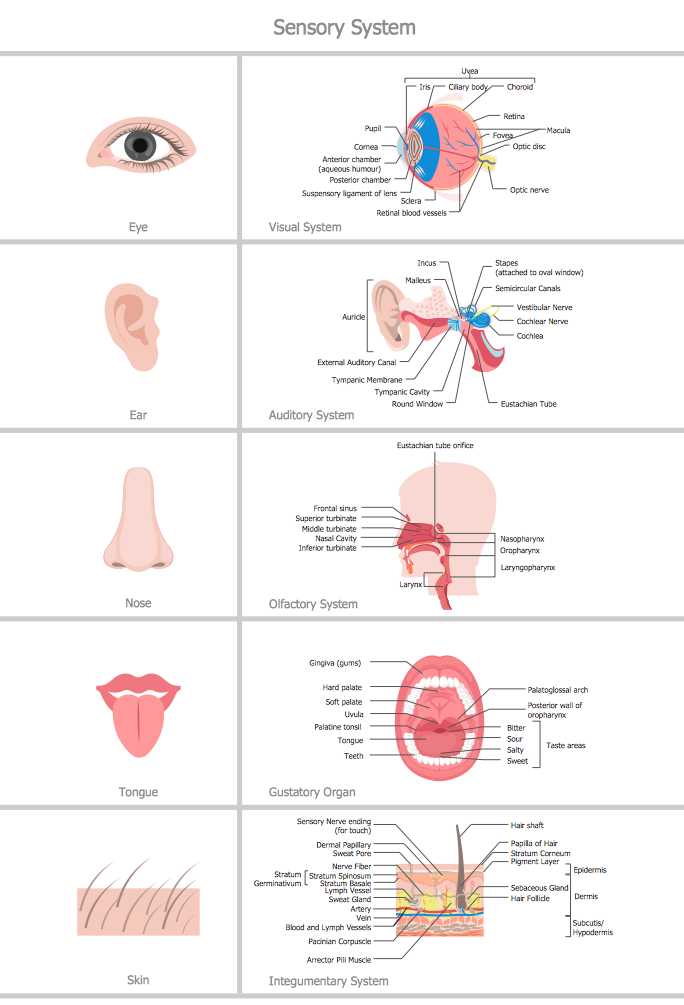
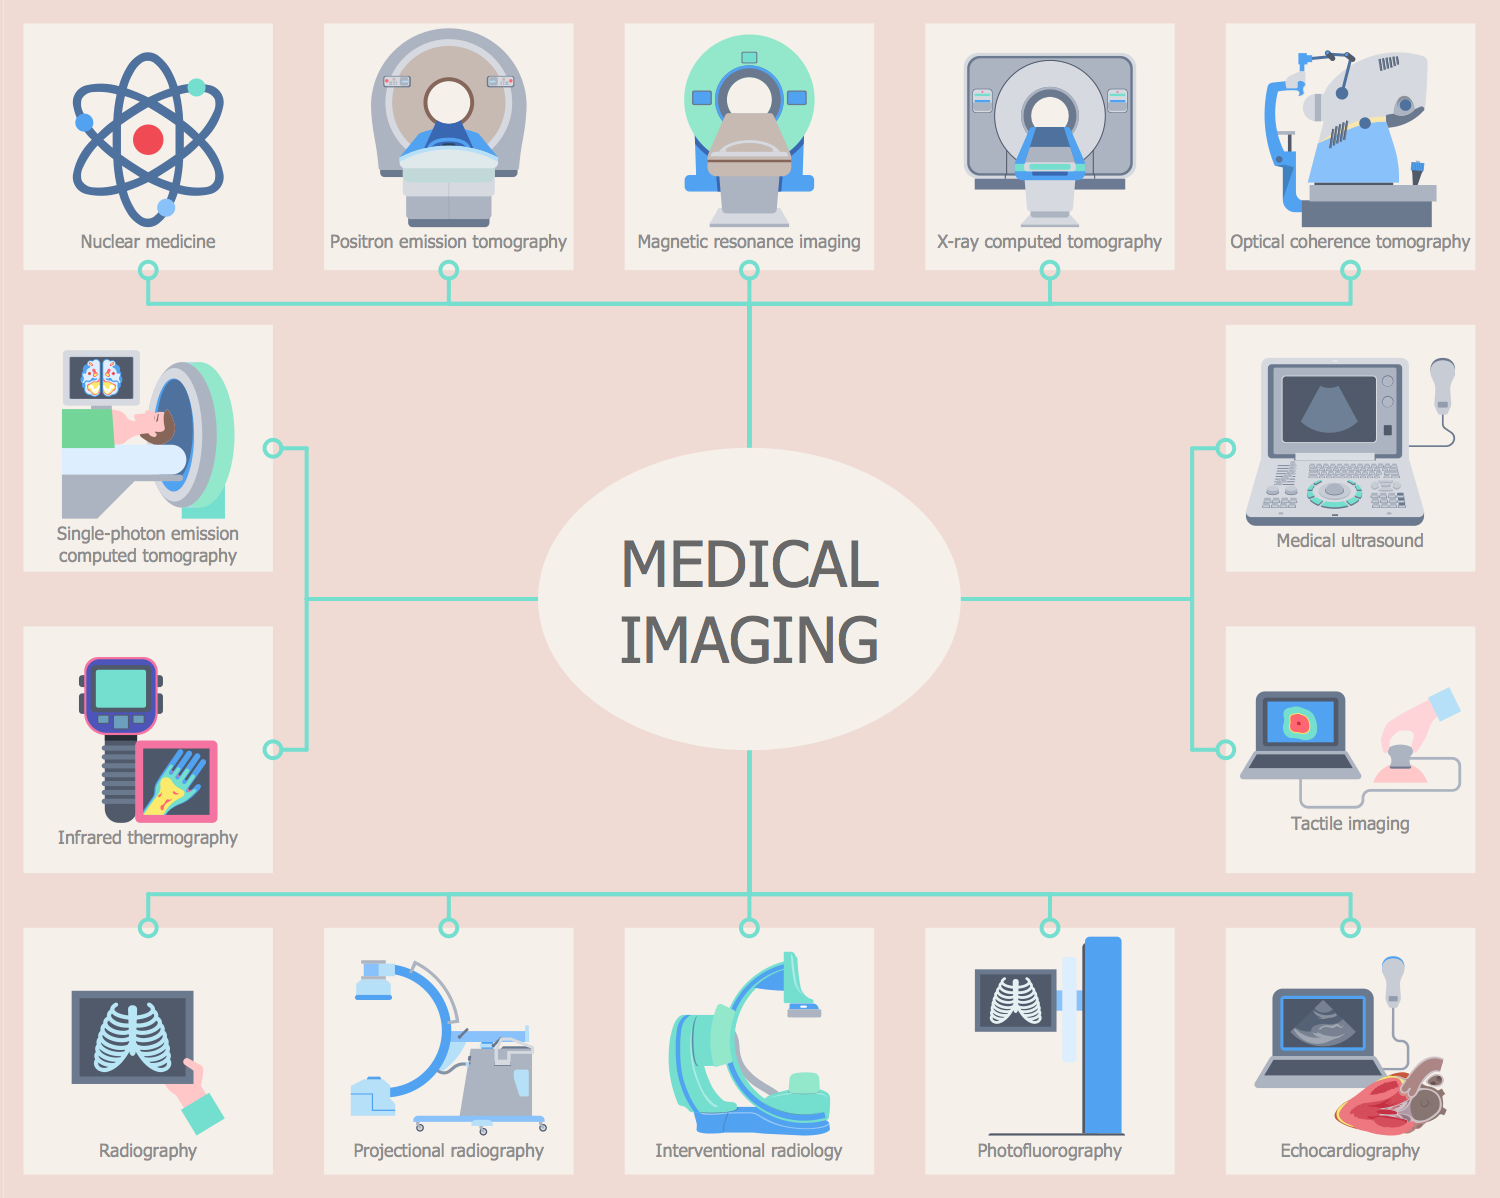
Medical Illustrations solution including the set of professionally developed examples and samples dedicated to medicine, large variety of ready-to-use vector objects and icons of diagnostic equipment, treatment equipment, medical instruments, tools and devices, medical professionals and health workers of different medical specialties, medical procedures and patients, medical pictograms and medical symbols, among which are the famous red cross symbol, heartbeat symbol, doctor symbol, and many others, is a perfect help in questions of medical illustration and medical imaging, creation professional-looking, colorful and attractive Medical illustrations, Medical diagrams and infographics, slides for presentations in a field of medicine and health care, depicting the medical facts, the information about varied diseases and ways of medical diagnosis, methods of prevention and treatment diseases.
Health Sciences
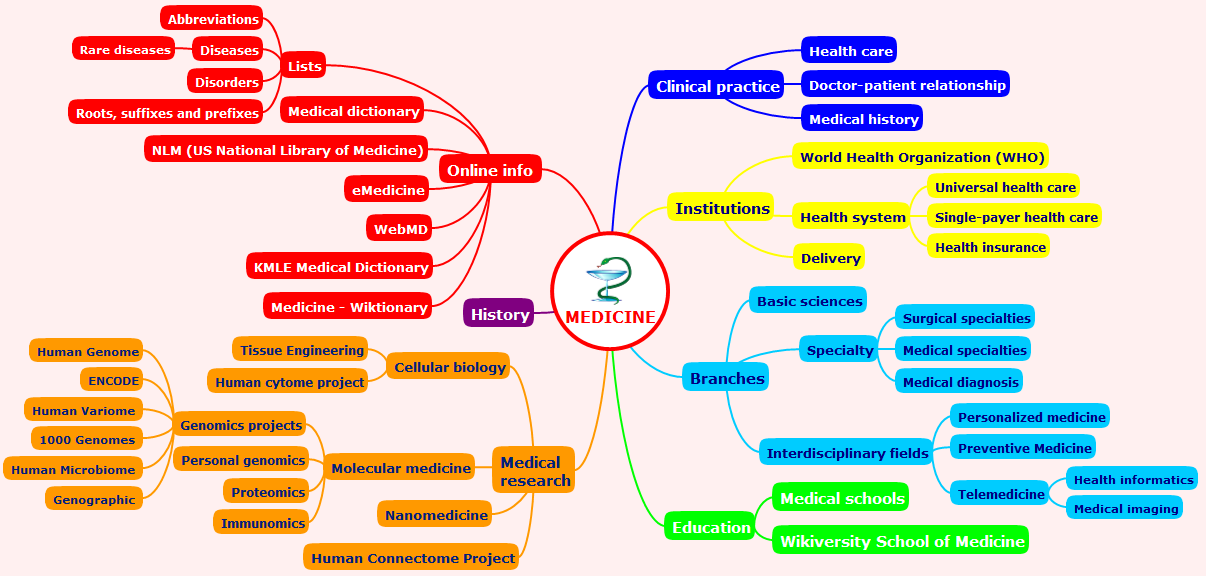
Health Sciences solution including professionally designed samples and wide range of high-quality vector icons and pictograms of basic medical sciences, surgery specializations, internal medicine, medical diagnostics, interdisciplinary fields, mental health, obstetrics and gynecology, public health, allied health, and other medical specialties, is a perfect assistant in drawing Health diagrams, schematics, illustrations, infographics and slides for presentations on the healthcare, medical and health sciences thematic, in development knowledge in health science, in studying and representing the physical, mental and social aspects of human health, in determining the role of different health sciences at this process, finding and explaining new methods of treatment different diseases, making an overview and describing the main characteristics of health sciences in a visual form.
Design Pictorial Infographics. Design Infographics
In the course of recent decades data visualization went through significant development and has become an indispensable tool of journalism, business intelligence and science. The way visual information may be conveyed is not limited simply to static or dynamic representation, it can also be interactive. Infographics can be conditionally divided into several general levels. Primarily, this is level of visualization of information, its interpretation and association on any ground. Second level can be defined as a visualization of knowledge, depiction of thoughts and ideas in the form of images or diagrams. Finally, the level of data visualization, which processes data arrays in charts, enabling the information to be more clearly perceived. You can also identify the main approaches to the creation of infographics: exploratory and narrative. Exploratory method insists on minimalist design in favor of data precision without unnecessary details and is common for scientific researches and anaPresenting Documents with Remote Presentation for Skype Solution
Video tutorials on ConceptDraw products. Try it today!Health Area
The Health Area of ConceptDraw Solution Park collects solutions containing samples, templates and numerous libraries with vector objects and clipart perfect for designing the illustrations, diagrams and infographics devoted to the human's anatomy, its hea
Bubble Map Maker
The Bubble Map is a popular tool for visualization a data set which is widely used in economics, medicine, software engineering, architecture, and many other fields. Each bubble on the Bubble Map is characterized by coordinates, color and size. ConceptDraw DIAGRAM diagramming and vector drawing software extended with Business Diagrams Solution from the Management Area is a powerful Bubble Map Maker.Basic of Flowchart: Meaning and Symbols
Flowcharts are the best for visually representation the business processes and the flow of a custom-order process through various departments within an organization. ConceptDraw DIAGRAM diagramming and vector drawing software extended with Flowcharts solution offers the full set of predesigned basic flowchart symbols which are gathered at two libraries: Flowchart and Flowcharts Rapid Draw. Among them are: process, terminator, decision, data, document, display, manual loop, and many other specific symbols. The meaning for each symbol offered by ConceptDraw gives the presentation about their proposed use in professional Flowcharts for business and technical processes, software algorithms, well-developed structures of web sites, Workflow diagrams, Process flow diagram and correlation in developing on-line instructional projects or business process system. Use of ready flow chart symbols in diagrams is incredibly useful — you need simply drag desired from the libraries to your document and arrange them in required order. There are a few serious alternatives to Visio for Mac, one of them is ConceptDraw DIAGRAM. It is one of the main contender with the most similar features and capabilities.- Medicine and health pictograms - Vector stencils library | Basic ...
- Microsoft Azure | Internal Medicine | Flowchart Software | Skill Clipart ...
- Flow chart Example. Warehouse Flowchart | Medicine and health ...
- Process Flowchart | Medical Illustrations | Pharmacy Illustrations ...
- Medical Symbol | Medical Illustrations | Basic Flowchart Symbols ...
- Flowchart design. Flowchart symbols, shapes, stencils and icons ...
- Social Media Response | UML Use Case Diagram Example. Social ...
- U.S. Medicare spending per capita | Process Flowchart | Pie Charts ...
- Garrett IA Diagrams with ConceptDraw PRO | Healthcare ...
- Types of Flowcharts | Healthcare Management Workflow Diagrams ...