Pyramid Chart Examples
Pyramid Charts and Triangle Diagrams are used to visually structure the topics and progressively order the quantitative data. They allow to illustrate hierarchical structure of the topics, proportional, interconnected and containment relations among the topics. The multilevel Pyramids and Triangle diagrams are constructed oriented up or down and divided into several horizontal slices. They are effectively used to represent marketing strategies, social strategies, information systems, market value, etc., to illustrate presentations, websites, documents, reports in business, finances, sales, management, marketing, media, training, consulting, and many other fields. To maximize the efficiency in drawing the Pyramid Charts, use the ConceptDraw DIAGRAM diagramming and vector drawing software extended with Pyramid Diagrams solution from Marketing area, which contains the set of Pyramid Chart examples, samples, templates and vector design elements of triangular diagrams and pyramids with different quantity of levels for various needs.Databases Access Objects Model with ConceptDraw DIAGRAM
ConceptDraw Basic gives the opportunity of interaction with any ODBC-compatible databases. For this the Database Access Objects Model is provided. All calls to the database are made by certain methods of objects of this model.Competitor Analysis
Competitor analysis is a first and obligatory step in elaboration the proper corporate marketing strategy and creating sustainable competitive advantage. Use powerful opportunities of numerous solutions from ConceptDraw Solution Park for designing illustrative diagrams, charts, matrices which are necessary for effective competitor analysis.3 Ways to Quickly Create Excellent Presentations
When you decide to represent data without spending lots of time you can effectively generate, change, and update your presentation to best meet your needs with ConceptDraw MINDMAP.
 Specification and Description Language (SDL)
For people in the field of systems engineering or system design, working with specification and description language (sdl) and finite state machines (fsm).
Visio Files and ConceptDraw
Visio Files and ConceptDraw. ConceptDraw DIAGRAM is compatible with MS Visio.VDX formatted files.VDX is Visio’s open XML file format, and it can be easily imported and exported by ConceptDraw DIAGRAM.
 ATM UML Diagrams
The ATM UML Diagrams solution lets you create ATM solutions and UML examples. Use ConceptDraw DIAGRAM as a UML diagram creator to visualize a banking system.
Genomics
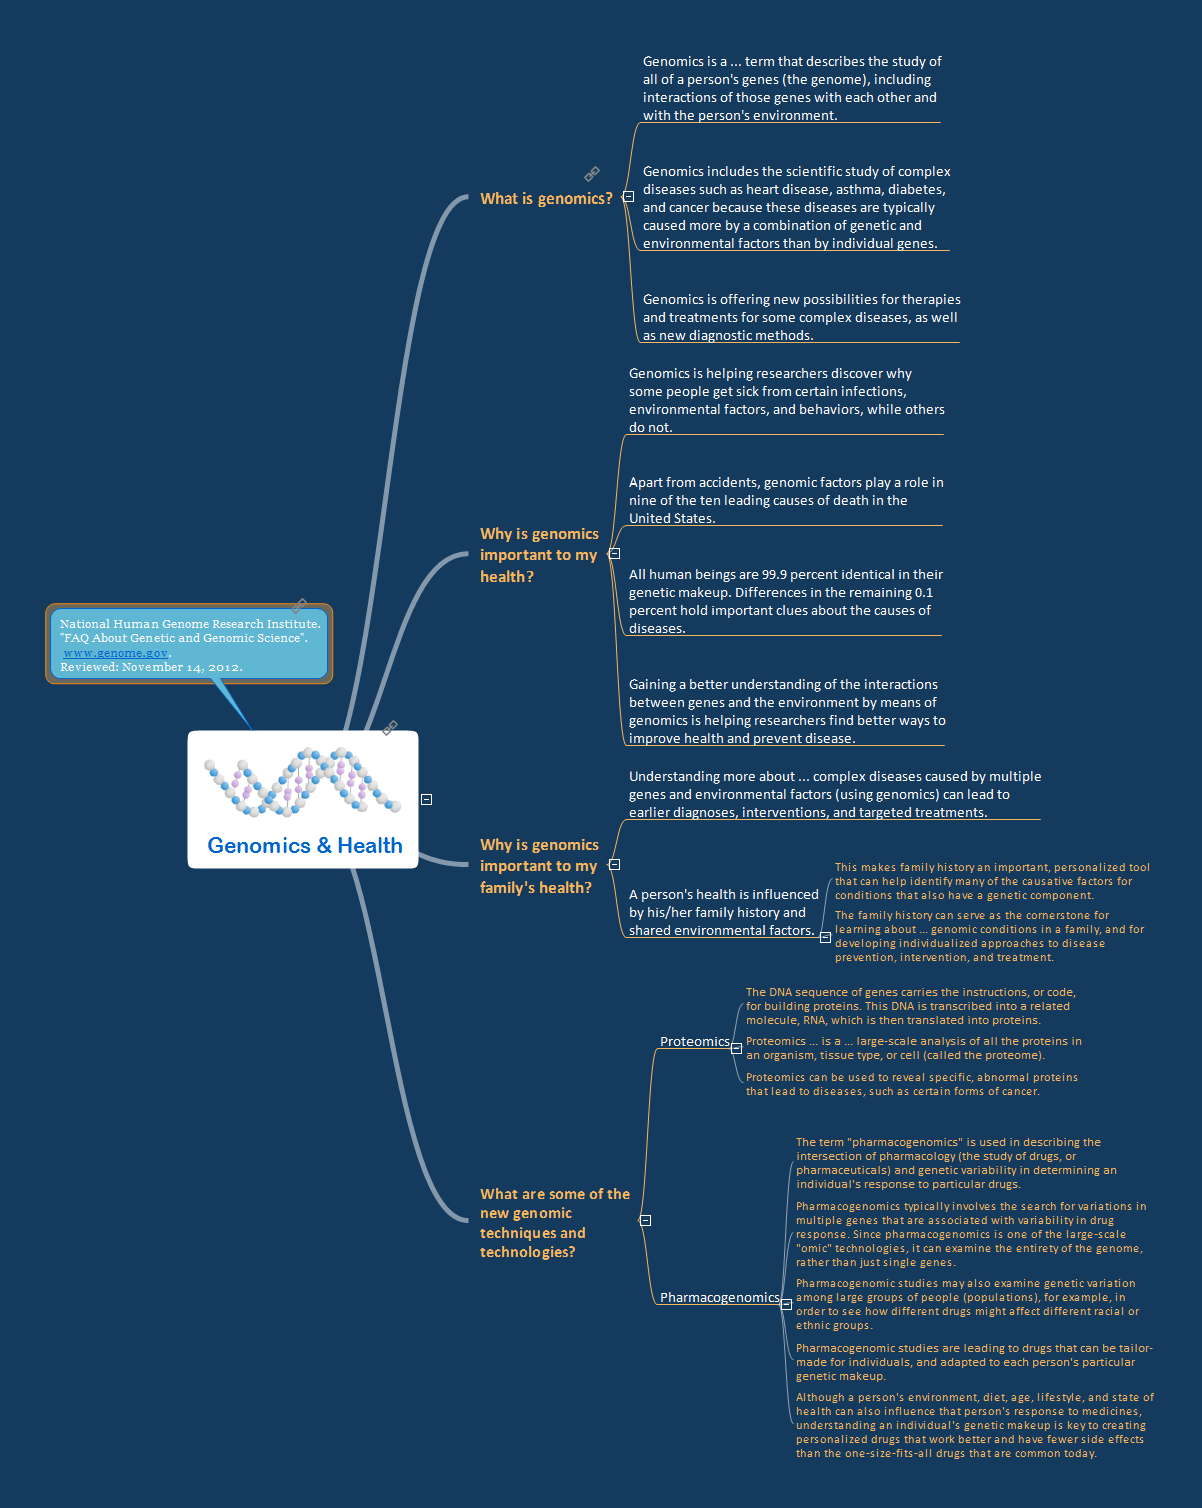
Genomics is a section of molecular genetics devoted to the study of genome and genes of living organisms. The human's genome is a totality of inheritable material that is enclosed in a person's cell. The main task of genomics is the establishment of a complete genetic characterization of the whole cell, definition the number of contained genes and their sequences, number of nucleotides in each gene and their sequences, the functions of each gene in relation to the metabolism of an organism. Genomics allows to express the essence of an organism, its potential opportunities, generic and individual differences from other organisms, to anticipate the reaction to the external impacts, knowing the sequence of nucleotides in each of genes and number of genes. Genetic engineering rapidly moves, the new discoveries and achievements in this field occur in incredibly fast pace. This Mind Map represents the list of FAQs about genetic and genomic science, and illustrates how useful are the Mind Maps for structuring information and explaining the complex subjects in a simplified manner. ConceptDraw MINDMAP lets you easy create Mind Map representing the main thesises for any science.
 IDEF Business Process Diagrams
Use the IDEF Business Process Diagrams solution to create effective database designs and object-oriented designs, following the integration definition methodology.
- Memory Hierarchy Diagram Triangle
- With The Aid Of A Diagram Explain Memory Hierarchy
- Knowledge hierarchy triangle diagram | Graham's hierarchy of ...
- Draw Memory Pyramid Com
- Top brand model - Pyramid diagram | Memory Pyramid Diagram
- Knowledge hierarchy triangle diagram | Pyramid Diagrams | Bubble ...
- Knowledge hierarchy triangle diagram | Pyramid Diagram | Pyramid ...
- Knowledge hierarchy triangle diagram | Graham's hierarchy of ...
- Graham's hierarchy of disagreement - Pyramid diagram | 4 Level ...


