"Metabolism is refer to all chemical reactions that occur in living organisms, including digestion and the transport of substances into and between different cells. Metabolism is usually divided into catabolism, that breaks down organic matter and harvests energy by way of cellular respiration, and anabolism that uses energy to construct components of cells such as proteins and nucleic acids.
The chemical reactions of metabolism are organized into metabolic pathways, in which one chemical is transformed through a series of steps into another chemical, by a sequence of enzymes." [Metabolism. Wikipedia]
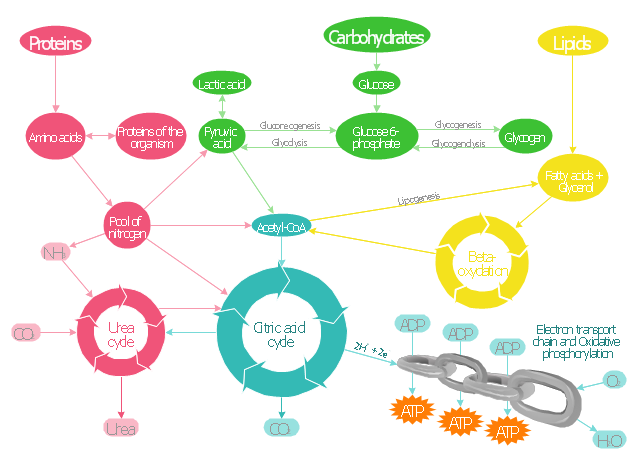
The biochemical pathway map example "Key metabolic processes" was created using the ConceptDraw PRO diagramming and vector drawing software extended with the Biology solution from the Science and Education area of ConceptDraw Solution Park.
 Biology
Biology solution extends ConceptDraw DIAGRAM software with samples, templates and libraries containing biological vector symbols, to help you create scientific and educational designs in the field of biology.
The vector stencils library "Citric acid cycle (TCA cycle)" contains 26 symbols of metabolites for drawing metabolic pathway maps and biochemical shematic diagrams of the citric acid cycle (TCA cycle, tricarboxylic acid cycle, Krebs cycle) and diagrams of metabolism processes.
"The citric acid cycle - also known as the tricarboxylic acid cycle (TCA cycle), or the Krebs cycle, - is a series of chemical reactions used by all aerobic organisms to generate energy through the oxidation of acetate derived from carbohydrates, fats and proteins into carbon dioxide and chemical energy in the form of adenosine triphosphate (ATP). In addition, the cycle provides precursors of certain amino acids as well as the reducing agent NADH that is used in numerous other biochemical reactions. Its central importance to many biochemical pathways suggests that it was one of the earliest established components of cellular metabolism and may have originated abiogenically.
The name of this metabolic pathway is derived from citric acid (a type of tricarboxylic acid) that is consumed and then regenerated by this sequence of reactions to complete the cycle. In addition, the cycle consumes acetate (in the form of acetyl-CoA) and water, reduces NAD+ to NADH, and produces carbon dioxide as a waste byproduct. The NADH generated by the TCA cycle is fed into the oxidative phosphorylation (electron transport) pathway. The net result of these two closely linked pathways is the oxidation of nutrients to produce usable chemical energy in the form of ATP." [Citric acid cycle. Wikipedia]
The shapes example "Design elements - TCA cycle" is included in the Biology solution from the Science and Education area of ConceptDraw Solution Park.
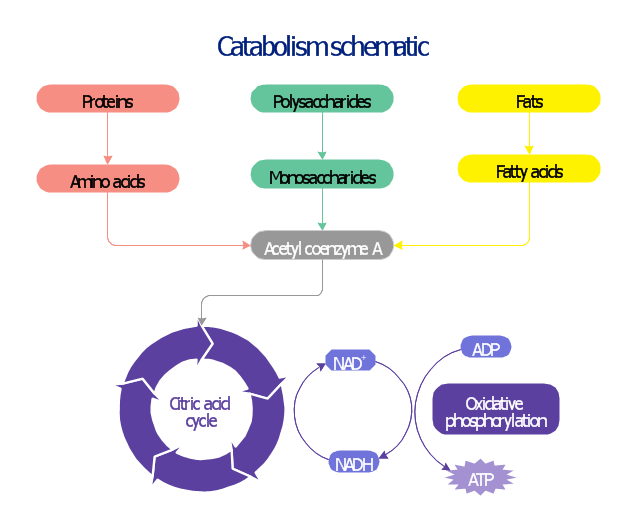
This biochemical chart display how proteins, polysaccharides and fats from food are digested into gastrointestinal tract into aminoacids, monosaccharides and fatty acids, and then broken down and oxidized to carbon dioxide and water in cellular processes of energy generation.
This metabolic pathway map was redesigned from Wikipedia file: Catabolism schematic.svg. [en.wikipedia.org/ wiki/ File:Catabolism_ schematic.svg]
The biochemical diagram example "Catabolism schematic" was created using the ConceptDraw PRO diagramming and vector drawing software extended with the Biology solution from the Science and Education area of ConceptDraw Solution Park.
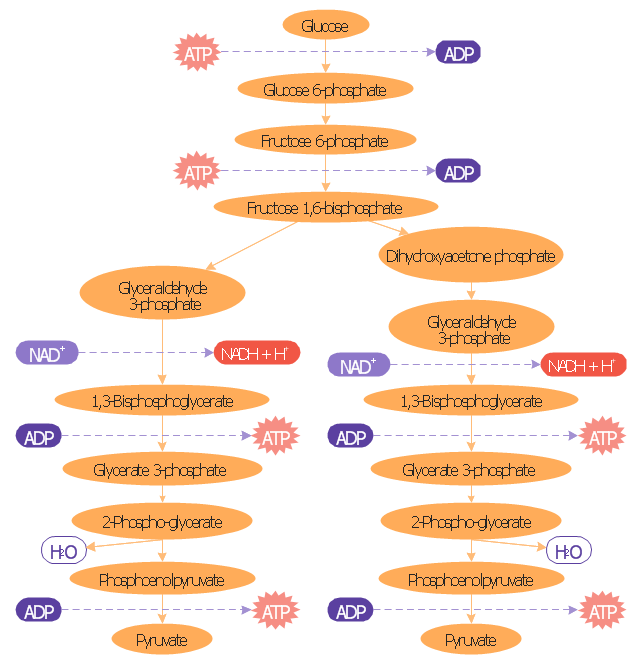
"Glycolysis is the metabolic pathway that converts glucose into pyruvate. The free energy released in this process is used to form the high-energy compounds ATP (adenosine triphosphate) and NADH (reduced nicotinamide adenine dinucleotide)." [Glycolysis. Wikipedia]
This biochemical diagram was redesigned from Wikimedia file: Glycolysis overview.svg. [commons.wikimedia.org/ wiki/ File:Glycolysis_ overview.svg]
The glucose metabolism diagram example "Glycolysis overview" was created using the ConceptDraw PRO diagramming and vector drawing software extended with the Biology solution from the Science and Education area of ConceptDraw Solution Park.
Business Diagram Software
When managing the projects, people, or networks, there are daily designed and used different types of Business diagrams, so the powerful drawing software will be very useful for this. ConceptDraw DIAGRAM with large quantity of business solutions will meet your needs and will help you convey your ideas successful and rapidly, no matter are you professional or beginner. It is the best choice for business specialists and technical professionals who need quickly and easily explore, visualize, and communicate information. ConceptDraw DIAGRAM business diagram software is the most powerful business software and relational charting software. Create advanced, completely customizable Business Process Diagrams, Business Flow Charts, Work Flow Diagrams, Organizational Charts, Audit diagrams, Marketing diagrams, Value Stream Maps, TQM diagrams, ERD diagrams, EPC diagrams, Cause and Effect diagrams, Infographics, Dashboards, and other Relational business diagrams from your data using the powerful drawing tools of ConceptDraw Solution Park.
Network Community Structure. Computer and Network Examples
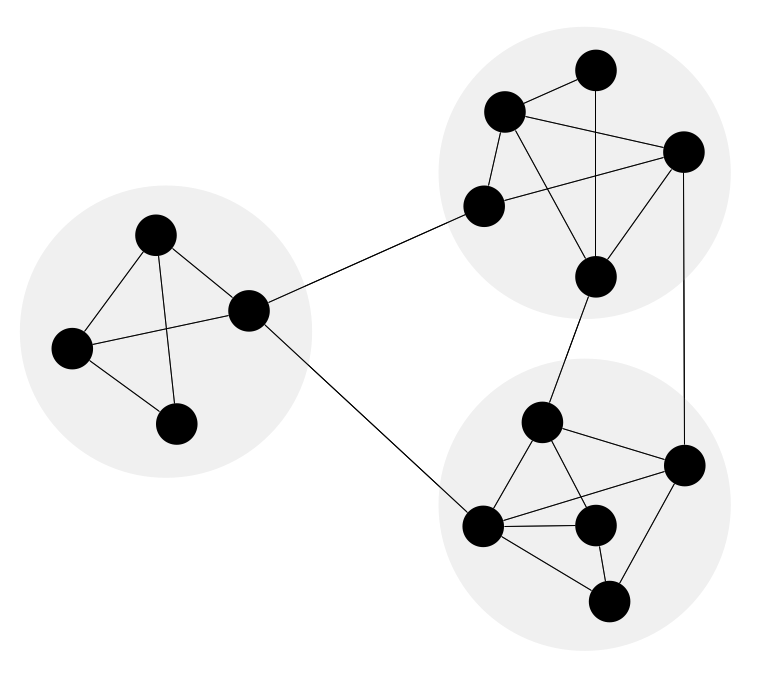
Network community structure is a network which nodes can be easily grouped into the sets of nodes with dense internally connections. This example shows a network that displays the community structure with three groups of nodes with dense internal connections and sparser connections between the groups.
- Biochemical pathway map - Key metabolic processes
- Biochemical metabolic pathway map diagram | Biochemical ...
- Key metabolic processes - Biochemical pathway map | Metabolic ...
- Biochemical pathway map - Key metabolic processes | Catabolism ...
- Biochemical pathway map - Key metabolic processes | Glucose ...
- Biochemical pathway map - Key metabolic processes |
- Biochemical pathway map - Key metabolic processes | Design ...
- Biochemical pathway map - Key metabolic processes |
- Metabolic pathway map - Biochemical diagram | Glycolysis overview ...
- Biology | Biochemical metabolic pathway map diagram ...
- Metabolic pathway map - Biochemical diagram | Design elements ...
- Metabolic pathway map - Biochemical diagram | Catabolism ...
- Metabolic pathway map - Biochemical diagram | Metabolic pathway ...
- Biochemical metabolic pathway map diagram |
- Biochemical metabolic pathway map diagram | Catabolism schematic |
- Design elements - Biochemistry of metabolism | Metabolic pathway ...
- Citric acid cycle (TCA cycle) | Design elements - Biochemistry of ...
- Bio Flowchart Lite | Biochemical metabolic pathway map diagram ...
- Chemistry | Metabolic pathway map - Biochemical diagram ...
- Metabolic pathway map - Biochemical diagram | Biology | Design ...

-symbols--design-elements---tca-cycle.png--diagram-flowchart-example.png)


