KPIs and Metrics
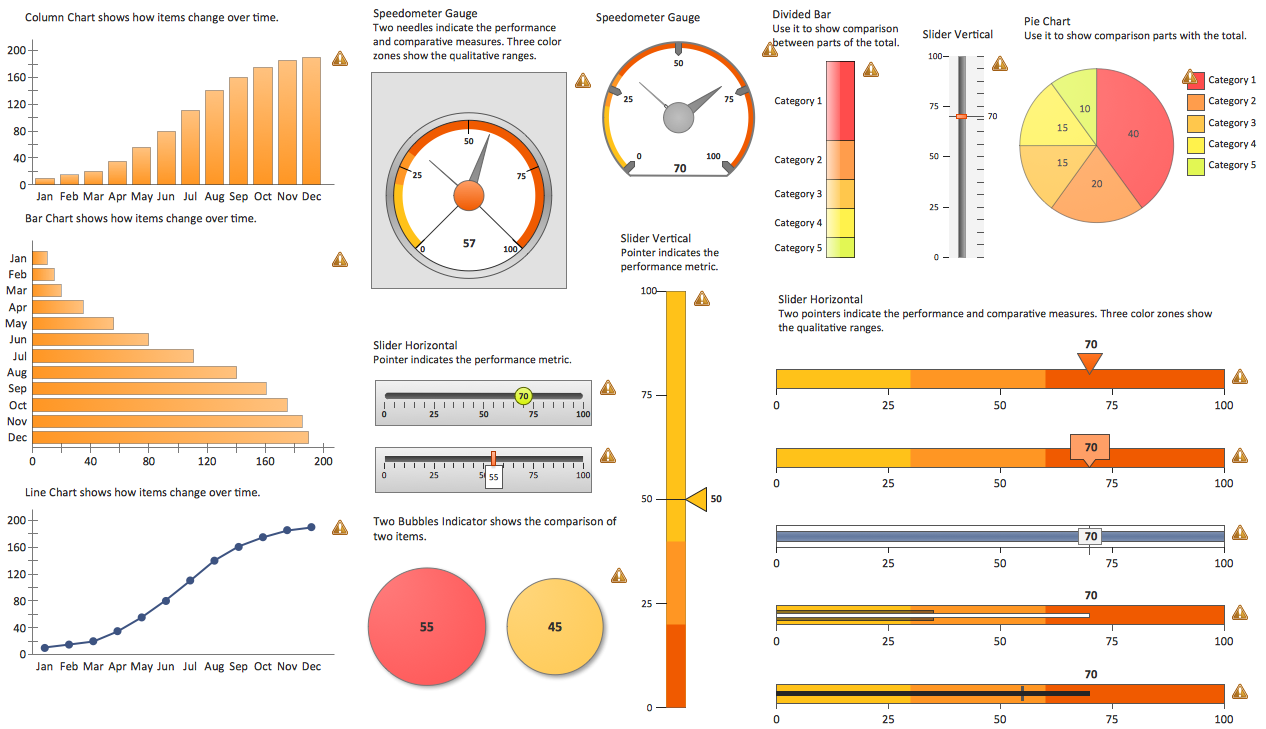
The choice of KPIs and metrics you use is key point of success when measuring sales process. Visualizing sales data using ConceptDraw Sales Dashboard solution for ConceptDraw PRO gives you a choice from numerous pre-designed indicators for different metrics you may need.The Facts and KPIs
Visualizing sales data help you see the facts and KPIs about your sales process to make conclusions and see how your business can improve.Visualize Sales Data Using Sample Data
ConceptDraw PRO software extended with the Sales Dashboard solution allows you visualize sales data using sample data delivered with the solution to choose visual indicators you need, and then connect these indicators to your real data.A KPI Dashboard Provides the Answers Your Sales Team
Sales dashboard is a tool that provides the answers to all questions your sales team may have. A mature sales dashboard provides complete set of KPI to shows corporate, team or personal performance to keep sales process clear.Financial Comparison Chart
This sample shows the Bar Chart of the leverage ratios for two major investment banks. The leverage ratio is the ratio of the total debt to the total equity; it is a measure of the risk taken by the bank. The higher of the leverage ratio denotes the more risk, the greater risks can lead to the subprime crisis.HelpDesk
How To Create an HR Metric Dashboard
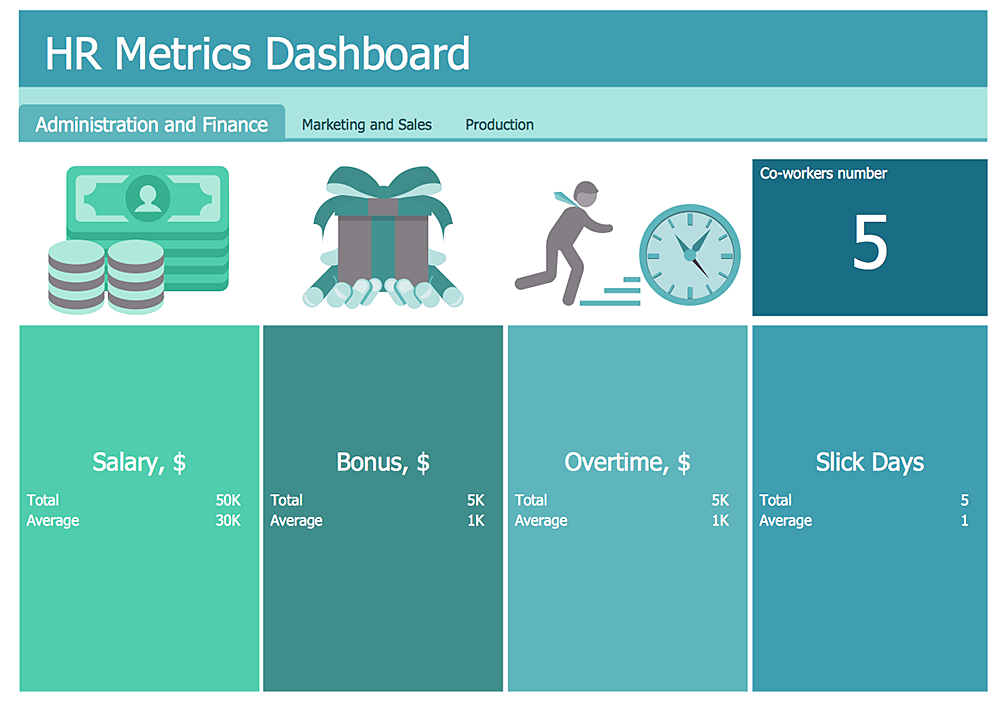
Human Resources dashboards can be used for analyzing hr workflow in an organization and identifying points for improvement. They are useful to HR managers, and for C level executives. HR dashboard helps to monitor HR KPIs. Thus Decision makers will be ensure that company strategy is aligned from executive, to managerial, to individual goals. HR Dashboard Solution for ConceptDraw PRO allows you to see what information you need from each KPI to see if your Human Resources management performs accurate and cost efficient.
 HR Dashboard
The HR Dashboard solution extends ConceptDraw PRO functionality with powerful drawing tools and great collection of comprehensive vector design elements, icons, pictograms and objects, navigation elements, live objects of HR charts, HR indicators, and thematic maps. The range of HR Dashboards applications is extensive, among them the human resource management, recruitment, hiring process, human resource development. ConceptDraw PRO software is perfect for creation HR Dashboard with any goal you need. It gives you all opportunities for designing not only informative, but also professional looking and attractive HR Dashboards of any style and degree of detalization, that are perfect for using in presentations, reports and other thematic documents.
Marketing Sales Funnel Examples
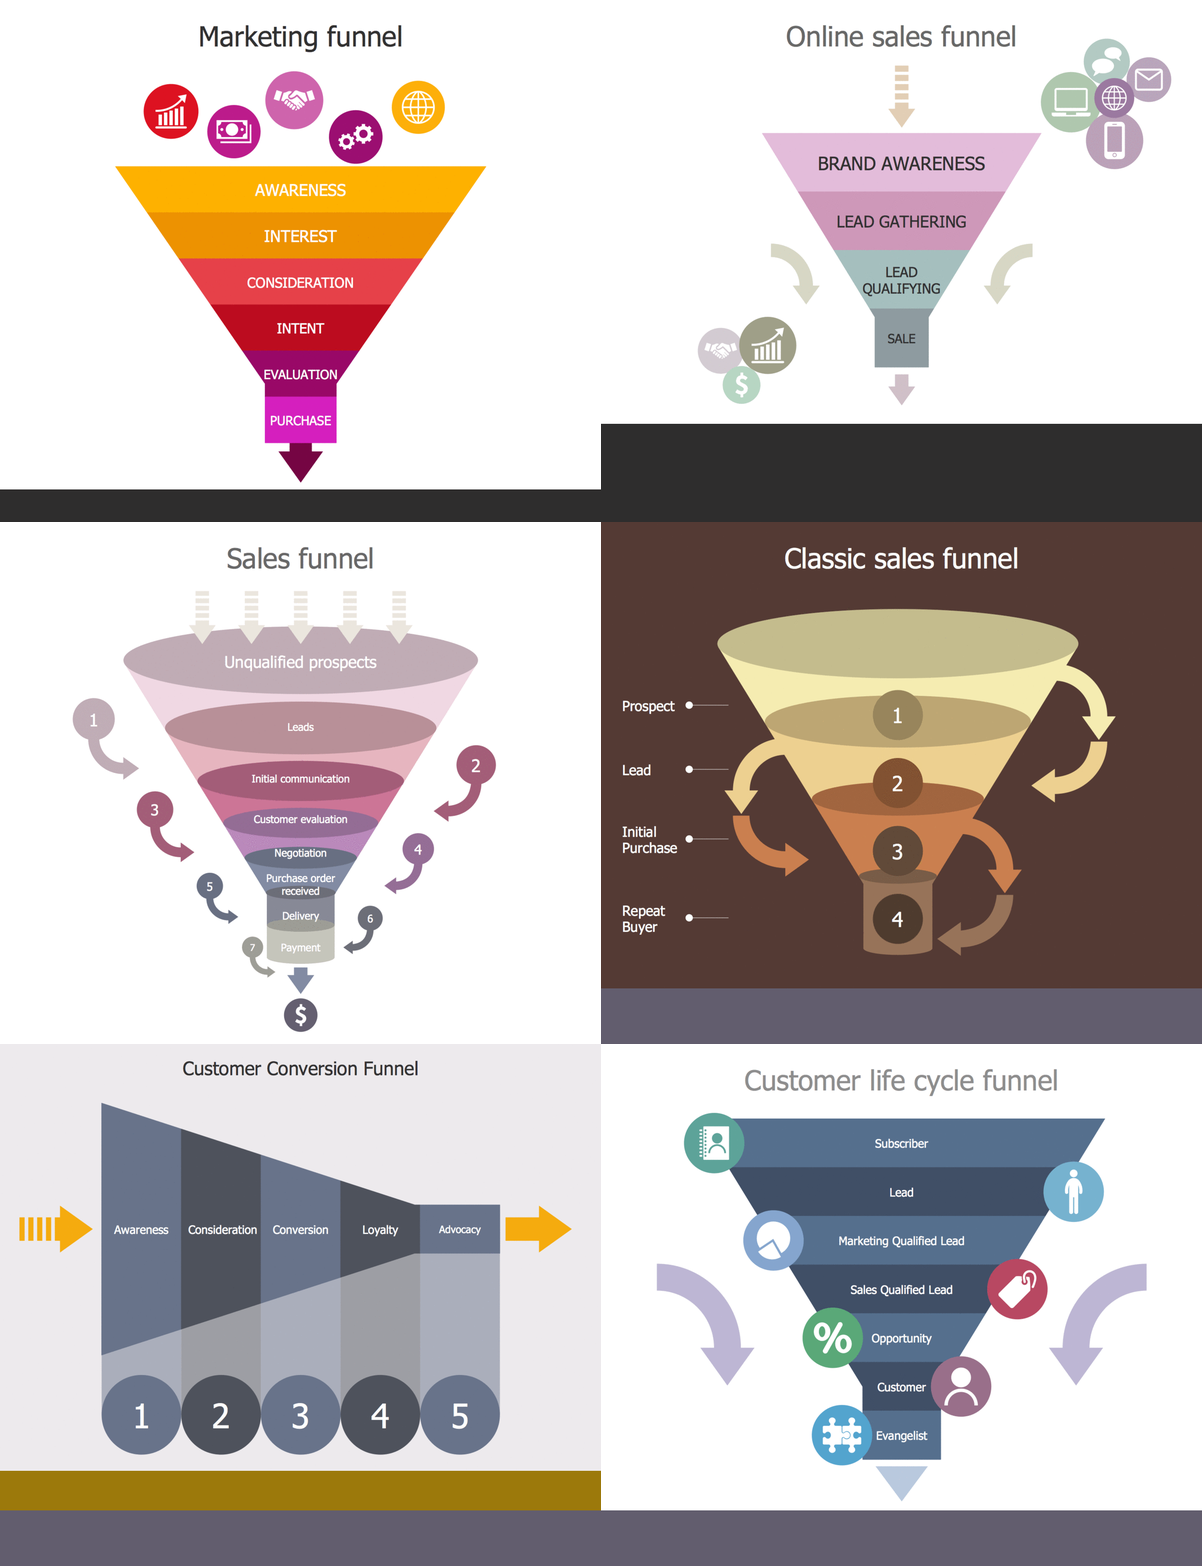
In order to boost your marketing results and so to increase the sales, the ConceptDraw PRO diagramming and vector drawing software can be used. The last-mentioned tool was developed especially for business specialists who seek for the right application to use in their field, including marketing. Having the Funnel Diagrams solution to use while working in the ConceptDraw PRO application may simplify your tasks of creating the professionally-looking marketing and sales funnel diagrams, such as the purchase ones.Competitor Analysis
Competitor analysis is a first and obligatory step in elaboration the proper corporate marketing strategy and creating sustainable competitive advantage. Use powerful opportunities of numerous solutions from ConceptDraw Solution Park for designing illustrative diagrams, charts, matrices which are necessary for effective competitor analysis.HelpDesk
How to Create a Sales Dashboard
Visual dashboard is a valuable tool for any sales team. Sales dashboard allows you to view and monitor sales indicators that are important for manager and sales staff . It helps to use the timely and reliable information to improve the quality of sales performance and increase sales revenues. ConceptDraw Sales Dashboard solution is a tool for both: sales manager and sales team. It provides the visualization of key performance indicators that are critical to the entire sales organization. The custom sales dashboard displays the real-time information on sales performance KPIs with the help of intuitive and easy-to-understand diagrams and charts.- Sales metrics and KPIs - Visual dashboard | Increase Sales Vector ...
- KPIs and Metrics | The Facts and KPIs | A KPI Dashboard | After ...
- Concept Draw Metrics
- Sales Dashboard | Sales Graph Of Company
- KPIs and Metrics | A KPI Dashboard | Sales KPI Dashboards ...
- Sales metrics and KPIs - Visual dashboard | Sales KPIs ...
- KPIs and Metrics | Visualize Sales Data Using Sample Data | Sales ...
- Sales KPIs and Metrics - Vector stencils library | Design elements ...
- Sales Dashboard Template | KPIs and Metrics | Sales Dashboard ...
- Cafe performance metrics vs. air temperature - Visual dashboard ...


