KPIs and Metrics
The choice of KPIs and metrics you use is key point of success when measuring sales process. Visualizing sales data using ConceptDraw Sales Dashboard solution for ConceptDraw DIAGRAM gives you a choice from numerous pre-designed indicators for different metrics you may need.Visualize Sales Data Using Sample Data
ConceptDraw DIAGRAM software extended with the Sales Dashboard solution allows you visualize sales data using sample data delivered with the solution to choose visual indicators you need, and then connect these indicators to your real data.The Facts and KPIs
Visualizing sales data help you see the facts and KPIs about your sales process to make conclusions and see how your business can improve.A KPI Dashboard Provides the Answers Your Sales Team
Sales dashboard is a tool that provides the answers to all questions your sales team may have. A mature sales dashboard provides complete set of KPI to shows corporate, team or personal performance to keep sales process clear.Competitor Analysis
Competitor analysis is a first and obligatory step in elaboration the proper corporate marketing strategy and creating sustainable competitive advantage. Use powerful opportunities of numerous solutions from ConceptDraw Solution Park for designing illustrative diagrams, charts, matrices which are necessary for effective competitor analysis.Reporting & Data Visualization
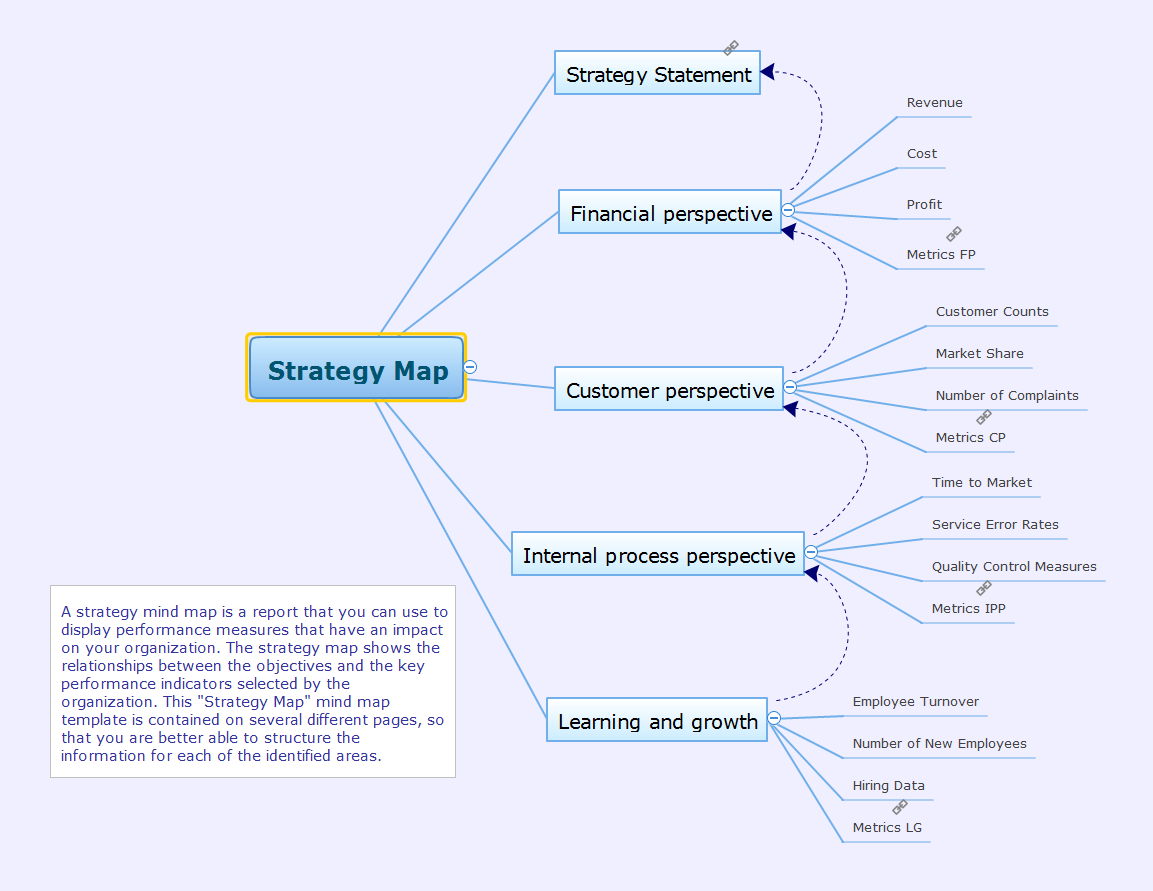
Using professional reporting and data visualization is the way your business can improve. ConceptDraw Sales Dashboard solution allows you produce live dashboards show KPI to monitor you sales activity and results in real time.Strategy Map
Mind map template of a strategy map that can help you display a variety of performance measures that can have an impact on your organization.Data Visualization Software Solutions
To see how your business can improve you can try data visualization software solutions that allows you visualize all your sales KPI in one sales dashboard allows you monitor and analyse sales activities.HR Dashboard
The HR Dashboard solution extends ConceptDraw DIAGRAM functionality with powerful drawing tools and great collection of comprehensive vector design elements, icons, pictograms and objects, navigation elements, live objects of HR charts, HR indicators, and thematic maps. The range of HR Dashboards applications is extensive, among them the human resource management, recruitment, hiring process, human resource development. ConceptDraw DIAGRAM software is perfect for creation HR Dashboard with any goal you need. It gives you all opportunities for designing not only informative, but also professional looking and attractive HR Dashboards of any style and degree of detalization, that are perfect for using in presentations, reports and other thematic documents.
Dashboard
ConceptDraw DIAGRAM extended with Sales Dashboard solution from the Marketing area of ConceptDraw Solution Park is a perfect software for creating the live dashboard for the business data and progress visualization.- Metrics Visualization
- KPIs and Metrics | Sales KPI Dashboards | A KPI Dashboard ...
- KPIs and Metrics | Visualize Sales Data Using Sample Data | Data ...
- Visualize Sales Data Using Sample Data | KPIs and Metrics | A KPI ...
- Data Visualization Software Solutions | Data Visualization Solutions ...
- KPIs and Metrics | Visualize Sales Data Using Sample Data | Sales ...
- Visualization Of Kpi Ppt
- KPIs and Metrics | A KPI Dashboard | Sales KPI Dashboards ...
- KPI Dashboard | Visualize Sales Data Using Sample Data ...
- Sales Dashboard Template | KPIs and Metrics | Sales Dashboard ...
- ERD | Entity Relationship Diagrams, ERD Software for Mac and Win
- Flowchart | Basic Flowchart Symbols and Meaning
- Flowchart | Flowchart Design - Symbols, Shapes, Stencils and Icons
- Flowchart | Flow Chart Symbols
- Electrical | Electrical Drawing - Wiring and Circuits Schematics
- Flowchart | Common Flowchart Symbols