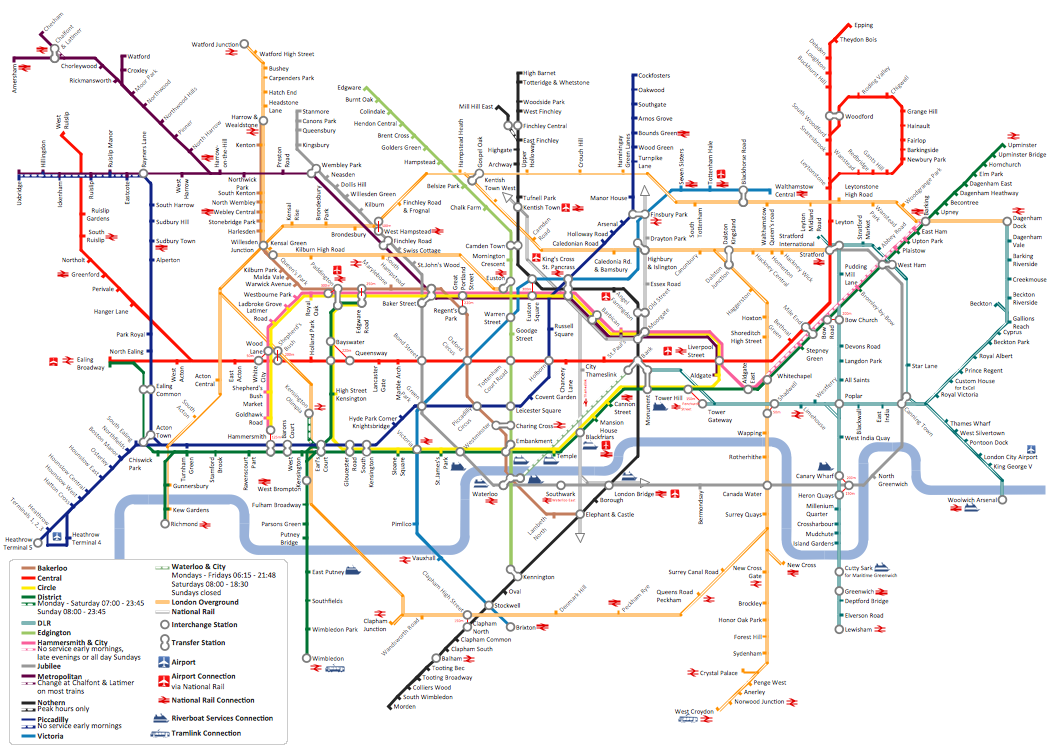
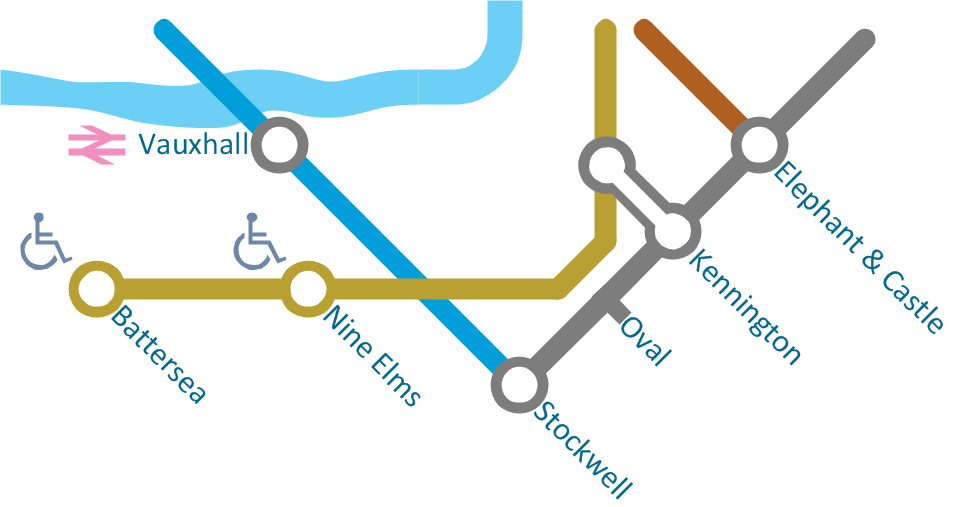
How to draw Metro Map style infographics? (London)
Tool to draw Metro Map styled inforgraphics. London Tube map sample.Metropolitan area networks (MAN). Computer and Network Examples
A Metropolitan Area Network (MAN) is a great computer network located on the large geographical area or region. It is a network bigger than Local Area Network (LAN), but territorially smaller than Wide Area Network (WAN), its diameter usually ranges from 5 to 50 kilometers. MAN usually includes several buildings or even the whole city (metropolis). It is based on high data rate compounds using the fiber channels and other digital data transmission channels. MAN includes a lot of communicating devices, for its construction are used multiple routers, switches and hubs. MAN can combine together several Local Area Networks or Campus Area Networks located in different buildings within a city and provides the Internet connectivity for them. Solutions included to Computer and Networks Area for ConceptDraw Solution Park are the real godsend for those who want design Computer Network Diagrams, and among others the Metropolitan Area Network Diagrams. They offer the libraries with ready-to-use vector design elements, professional-looking examples, samples and templates.
Best Vector Drawing Application for Mac OS X
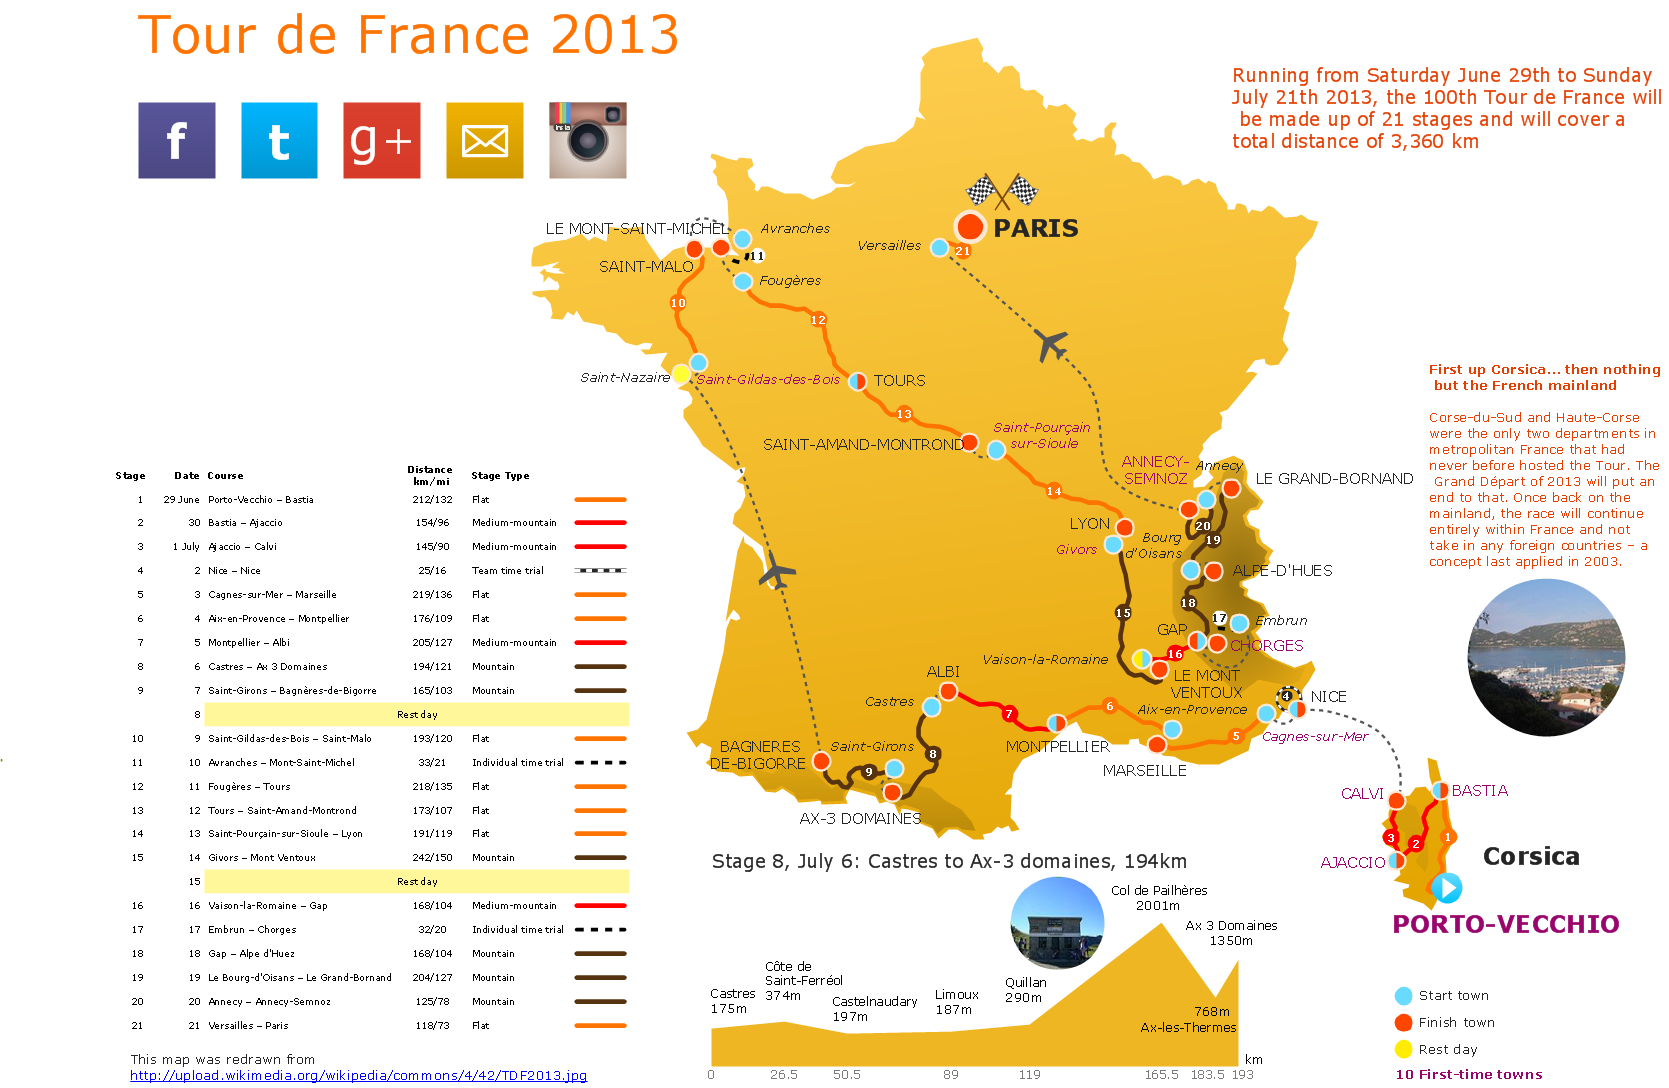
ConceptDraw DIAGRAM creates drawings, diagrams and charts with great visual appeal in Mac OS X.Map Infographic Design
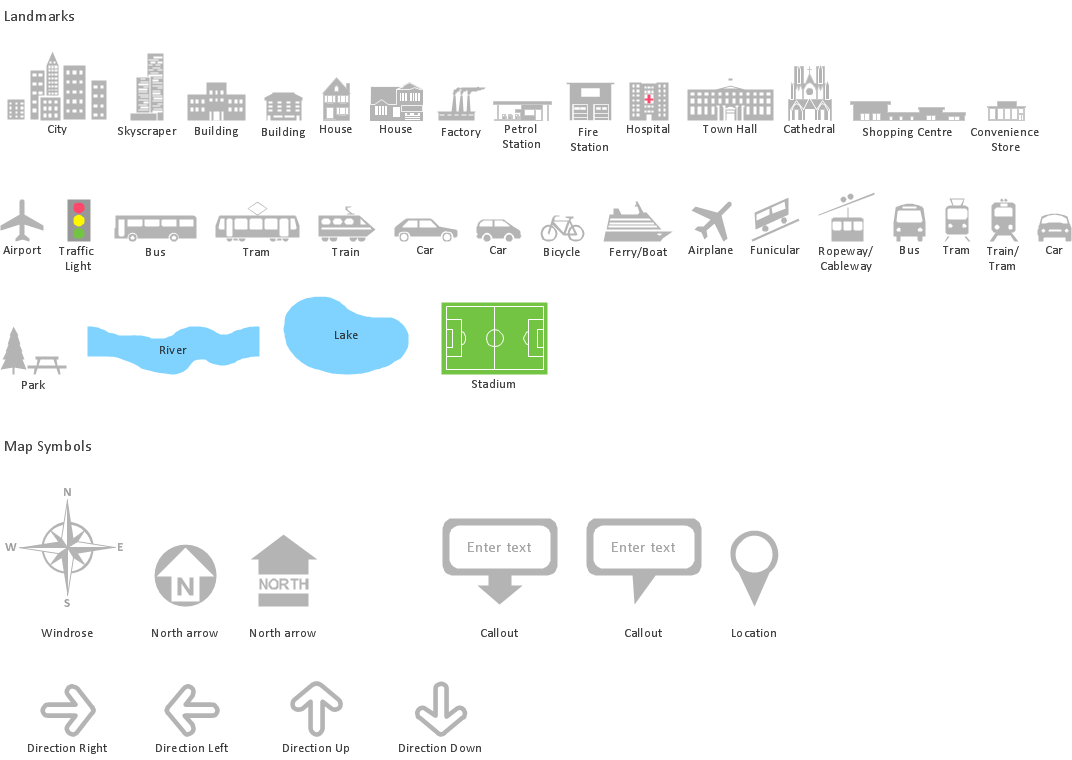
ConceptDraw collection of vector elements for infographics design.Cross-Functional Flowchart (Swim Lanes)
Cross-Functional Flowchart is a type of chart which shows the series of process steps connected by the arrows to depict their order and applies the swim lanes to provide an extra dimension with means of assigning each process step to certain category. Often the category or the functional unit is a stakeholder (department, person, role), resource, project, phase, or any other attribute. Cross-Functional Flowcharts visually illustrate relationships between the business processes and the functional units responsible for this processes. ConceptDraw DIAGRAM is a powerful diagramming and vector drawing software for professional design Cross-Functional Flowcharts using the common notation of shapes and swim lanes. Cross-Functional Flowcharts solution included to the Business Processes area of ConceptDraw Solution Park provides numerous well-designed vector objects and connector tools for quick, easy and effective organizing information, representing process flows and relationships, and drawing Cross-Functional Flowcharts for business, science, education, technology, etc.
 ConceptDraw Solution Park
ConceptDraw Solution Park collects graphic extensions, examples and learning materials
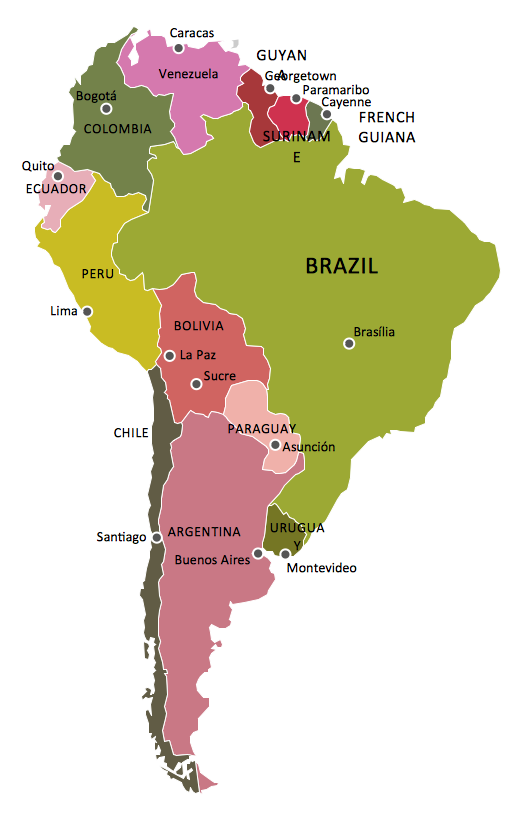
Geo Map — South America Continent
South America includes 12 sovereign states. ConceptDraw DIAGRAM is idea to draw the geological maps of South America continent from the pre-designed vector geo map shapes. Use Continent Maps solution from the Maps area of ConceptDraw Solution Park to draw thematic maps, geospatial infographics and vector illustrations for your business documents, presentations and websites.HelpDesk
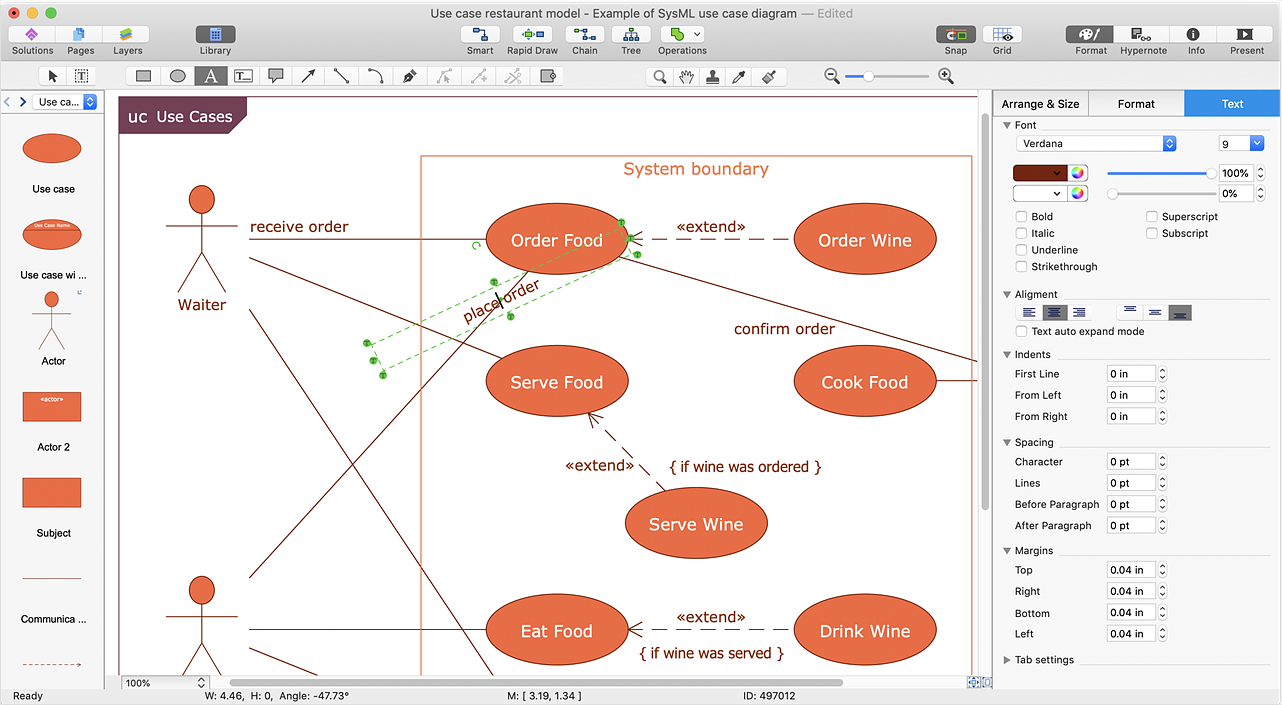
How to Add and Edit Connector Text
The new ConceptDraw Arrows10 Technology is a powerful diagramming technique that powered the way business drawing created. ConceptDraw DIAGRAM gives you some tools for connecting shapes: Direct Connectors, Smart, Arc, Bezier, Curve and Round Connectors.Direct Connectors are direct lines from the point to the point. Smart , Arc, Bezier, Curve and Round Connectors are almost the same as Direct Connectors. However, they automatically move around other objects. You can use Chain, or Tree connection mode for connection of multiple objects with any type of connectors. ConceptDraw DIAGRAM allows you to add and move text on a connector the same way that you add and move text on other any object.Venn Diagram Examples for Problem Solving
Venn diagrams are illustrations used in the branch of mathematics known as set theory. They show the mathematical or logical relationship between different groups of things (sets). A Venn diagram shows all the possible logical relations between the sets.Excellent Examples of Infographic Maps
Create Spatial infographics with ConceptDraw using its excellent examples of infographic maps. We hope these can inspire and teach you!How to Create a Powerful Infographic When You do not Have a Designer
Create a powerful infographic, become inspired by the people with ConceptDraw.Spatial Infographics
Not everyone can make spatial infographics from scratch, ConceptDraw will help you to create your own infographics.Electrical Symbols, Electrical Diagram Symbols
When drawing Electrical Schematics, Electrical Circuit Diagrams, Power Systems Diagrams, Circuit and Wiring Diagrams, Digital and Analog Logic Schemes, you will obligatory need the electrical symbols and pictograms to represent various electrical and electronic devices, such as resistors, wires, transistors, inductors, batteries, switches, lamps, readouts, amplifiers, repeaters, relays, transmission paths, semiconductors, generators, and many more. Today these symbols are internationally standardized, so the diagrams designed using them are recognizable and comprehensible by specialists from different countries. Electrical Engineering Solution included to ConceptDraw Solution Park provides 26 libraries with 926 commonly used electrical schematic and electrical engineering symbols making the reality the easy drawing of Electrical diagrams, schematics and blueprints. Now you need only a few minutes to create great-looking Electrical diagram, simply choose required electrical design elements from the libraries, drag them on the needed places at the document and connect in a suitable way.Blueprint Software
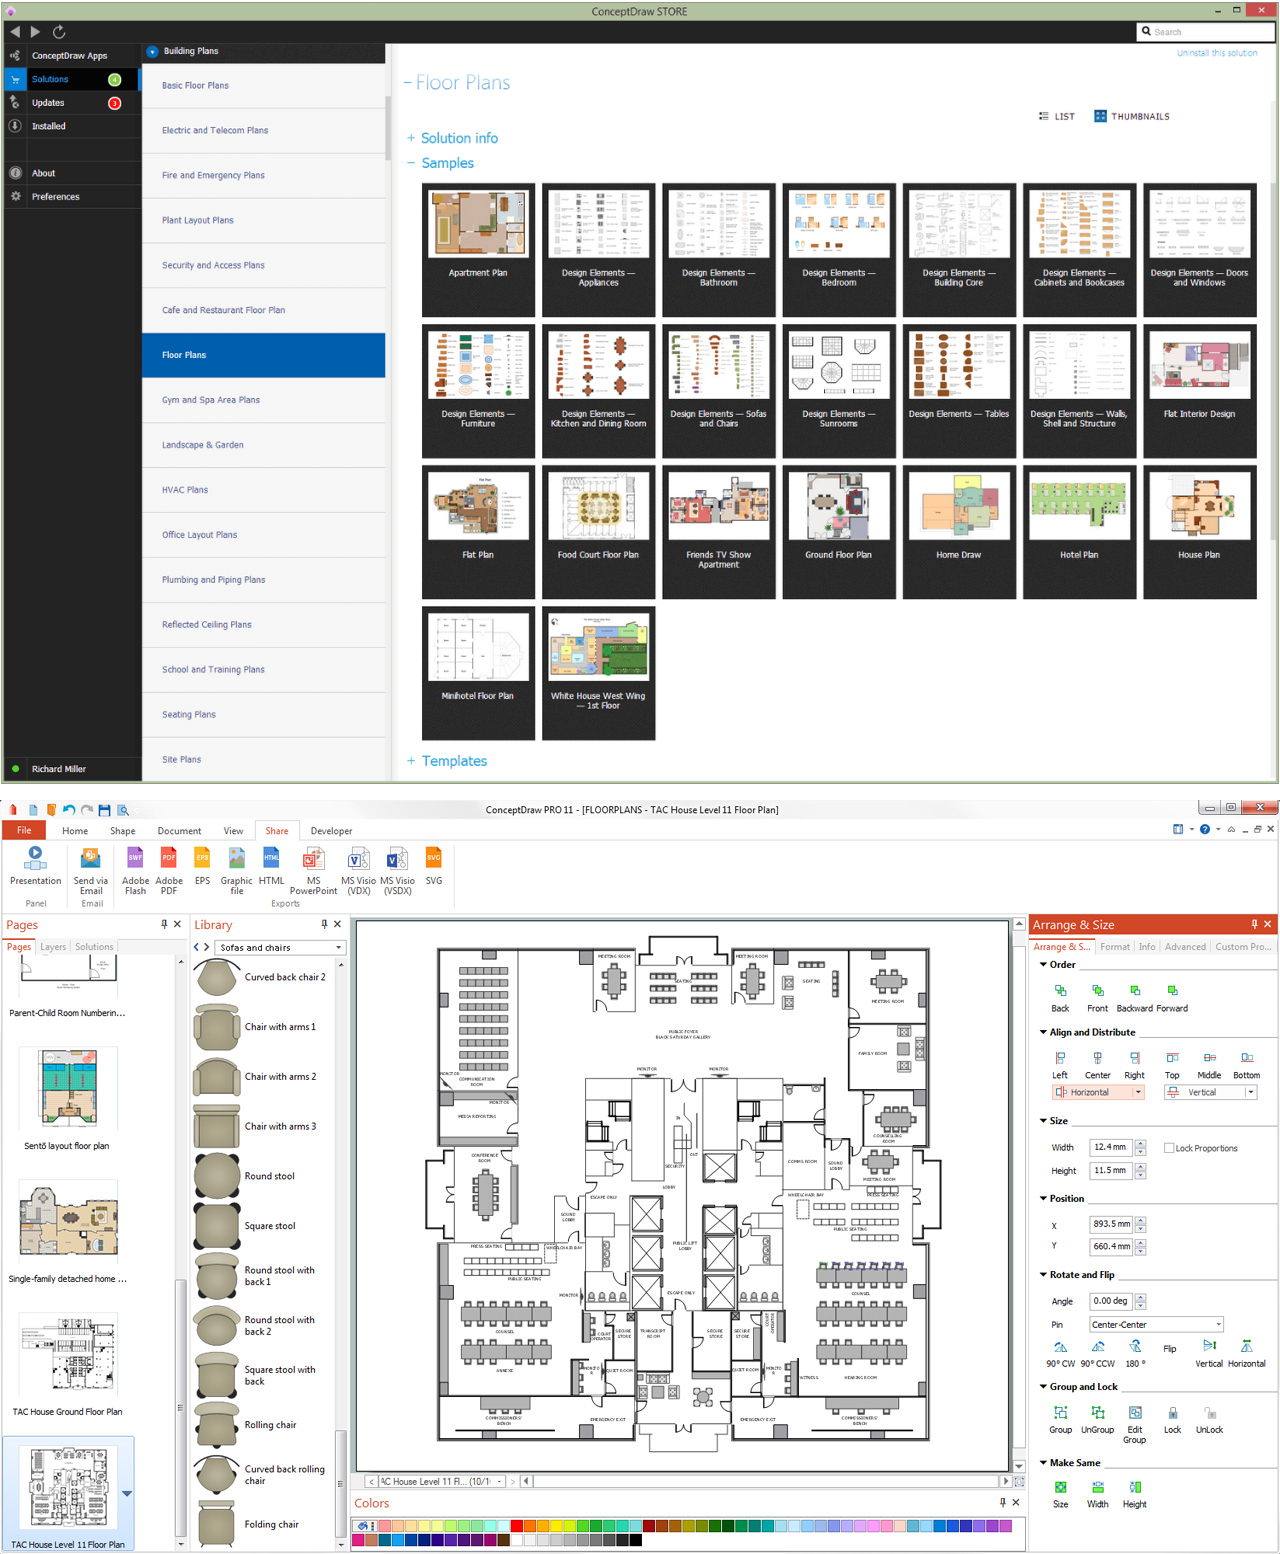
The blueprints are the set of drawings used by architects and builders in the process of construction of the buildings. The blueprints represent the top views on the buildings (homes, offices, etc.). They are drawn in the scale and use the special blueprint symbols and blueprints codes. Earlier the blueprints wer printed on the special paper and was blue. It's very easy, quick and convenient to draw the professional looking blueprints in ConceptDraw DIAGRAM diagramming and vector drawing software.- Simple Drawing Of Metro
- How To Draw Building Plans | How to draw Metro Map style ...
- How to Draw a Computer Network Diagrams | How to draw Metro ...
- Process Flowchart | How to draw Metro Map style infographics ...
- How to draw Metro Map style infographics? Moscow, New York, Los ...
- How to draw Metro Map style infographics? Moscow, New York, Los ...
- Process Flowchart | Basic Flowchart Symbols and Meaning | How to ...
- How to draw Metro Map style infographics? (London) | Metro Map ...
- Process Flowchart | How to draw Metro Map style infographics ...
- How to draw Metro Map style infographics? (London) | Value Stream ...
- How To Draw Building Plans | How to draw Metro Map style ...
- Infographic Software | How to draw Metro Map style infographics ...
- How to draw Metro Map style infographics? (Los Angeles) | How to ...
- Concept Maps | How to draw Metro Map style infographics? Moscow ...
- How to draw Metro Map style infographics? (London) | Create Flow ...
- Metropolitan area networks (MAN). Computer and Network Examples
- How to draw Metro Map style infographics? (London) | How to draw ...
- Simple Way To Draw Road Map
- Metro Map | Computer Network Diagrams | Computer and Networks ...
- Fire Exit Plan. Building Plan Examples | How to draw Metro Map ...
