The vector stencils library "Microsoft Exchange" contains 17 symbols of Microsoft Exchange elements for drawing the logical structure diagrams of Active Directory trees.
"Windows Messaging, initially called Microsoft Exchange, is an e-mail client that was included with Windows 95 (beginning with OSR2), 98 and Windows NT 4.0. ...
Microsoft Exchange gained wide usage with the release of Windows 95, as this was the only mail client that came bundled with it. In 1996, it was renamed to Windows Messaging, because of the upcoming release of Microsoft Exchange Server, and continued to be included throughout later releases of Windows up until the initial release of Windows 98, which by then included Outlook Express 4.0 as the default mail client.
The Windows Messaging email client had two branches of successors:
(1) In software bundled with Windows itself, these were Internet Mail and News in Windows 95 (and bundled with Internet Explorer 3), which was succeeded by Outlook Express 4.0 in Windows 98 (bundled with Internet Explorer 4.0 in Windows 95) and throughout newer Windows systems. These did not use the .pst file type.
(2) Microsoft Outlook became the professional-grade and more direct successor of MS Exchange Client, which still uses the .pst file type." [Windows Messaging. Wikipedia]
The symbols example "Microsoft Exchange - Vector stencils library" was created using the ConceptDraw PRO diagramming and vector drawing software extended with the Active Directory Diagrams solution from the Computer and Networks area of ConceptDraw Solution Park.
www.conceptdraw.com/ solution-park/ active-directory-diagrams
Do I Want to Go to Party
Mind Maps is an advanced decision-making technology, the spectrum of their application is extremely wide. The Mind Map algorithm is intuitive and involves abstractly-logical as well as figuratively-spatial thinking. Mind Maps allow effectively solve the business problems and help to make decisions more carefully. They allow to collect all information related to the task on a single sheet and to keep in sight all the pros and cons of one or other decision. The use of colors and visual images allows to activate associative thinking and intuition. Start a Mind Map design with representation of the main idea in center of the sheet. Place on the branches around the main idea the key means to achieve a goal and connect them with lines to the center. Then attach the topics with additional information. Use different colors for the main idea, for the branches and ideas of different levels, also symbols and drawings to illustrate the most important things on a Mind Map, and arrows to show relationships between the elements. In many cases, the process of drawing a Mind Map leads a person to the desired decision. ConceptDraw MINDMAP software allows you professionally design Mind Maps and visually explore the pros and cons for making decision.
 Sales Flowcharts
The Sales Flowcharts solution lets you create and display sales process maps, sales process workflows, sales steps, the sales process, and anything else involving sales process management.
SWOT Analysis
The success of the company depends on how successfully it is able to react on different outside influences. When analyzing the external situation, it is necessary to identify the factors most significant on a specified period of time. An interrelated consideration of these factors with the company's possibilities allows to solve effectively appearing problems. One of the most common methods of assessment together internal and external factors influencing the company's development is a SWOT analysis. SWOT analysis (acronym composed of the first letters of the words: strength, weakness, opportunities, threats) is one of the most common and effective types of analysis in marketing and marketing researches. It allows to identify and structure the strengths and weaknesses of an enterprise, as well as potential opportunities and threats of the market, to make conclusion in which direction a given organization needs to develop its business and to formulate the organization's strategy. Use the ConceptDraw MINDMAP software and offered SWOT analysis templates for easy holding SWOT analysis for your company. This Mind Map displays the SWOT analysis for a company and variety of performance measures that influence its work.Is ConceptDraw DIAGRAM an Alternative to Microsoft Visio?
Visio for Mac and Windows - ConceptDraw as an alternative to MS Visio. ConceptDraw DIAGRAM delivers full-functioned alternative to MS Visio. ConceptDraw DIAGRAM supports import of Visio files. ConceptDraw DIAGRAM supports flowcharting, swimlane, orgchart, project chart, mind map, decision tree, cause and effect, charts and graphs, and many other diagram types.Horizontal Org Flow Chart
This sample was created in ConceptDraw DIAGRAM charting and vector drawing software using the Organizational Charts Solution from the Management area of ConceptDraw Solution Park. The Organizational Chart is a diagram that shows the structure of the organization, different levels of management, hierarchy and relationships of the organization parts.Weekend To-Do List
How to spend a weekend with greatest benefit? Weekend is a perfect opportunity to relax, to recharge with energy and positivity for the upcoming week. Often the to-do list for weekend is a big enough, along with the planned entertainment activities, walking, visiting the theatre, cinema, zoo, restaurant, or any other places, this list often contains the housework, the item of cleaning apartment, buying foods,etc. In order to do everything and not forget anything, it is the best to think in advance the plan of actions for weekend and to sketch it. A visual planning tool, such as Mind Map is the most efficient for this purpose. The powerful software ConceptDraw MINDMAP is ideal for planning and organizing your weekend. Use the ConceptDraw MINDMAP tools to plan ahead your weekend according to your taste and preferences, to make easily your weekend to-do list and your personal list of top ideas on how to spend Saturday and Sunday. You can print your plan or send it to Evernote with a single click to have it always with you for reference.How To Do A Mind Map In PowerPoint
ConceptDraw MINDMAP - an excellent tool for exporting mind maps to PowerPoint to visualize and presenting your project. You can simply generate, change, update your mindmap and then make a presentation in PowerPoint.How to Deliver Presentations using Mind Maps
Creating and organizing presentations, structuring received presentations, presenting mind maps, and preparing for public presenting.Product Overview
ConceptDraw PROJECT is a vigorous tool for managing single or multiple projects. It lets you determine all essential elements involved into project, control schedules, resources and finances, and monitor projects' progress in most effective yet simple manner.Critical Tasks
All project tasks are important, but only some of them are critical. A task that cannot be delayed without affecting the project end date is a critical task. In other words it is a task, which directly affects the project finish date and at the delay of its implementation the project's finish date will be postponed. Conversely, to move the project end date to an earlier date, you must reschedule the dates of tasks of critical path. During the life of a real project often happens that the critical path changes the time to time, because the tasks may be completed sooner or later than they were planned. A task stops to be critical when it is executed, since more it does not affect the execution of subsequent tasks and on the project finish date. The critical path lets easy to see the project was ended on time or not, and to determine the location of dangerous points on it. ConceptDraw Office applications and PM solutions offered by ConceptDraw Solution Park support the project managers and senior managers with perfect abilities of easy planning and managing projects, tracking the project statuses and critical tasks, with tools for creation Gantt Charts, depiction the critical path and easy generation wide range of project reports.
 Interactive Voice Response Diagrams
Interactive Voice Response Diagrams solution extends ConceptDraw DIAGRAM software with samples, templates and libraries of ready-to-use vector stencils that help create Interactive Voice Response (IVR) diagrams illustrating in details a work of interactive voice response system, the IVR system’s logical and physical structure, Voice-over-Internet Protocol (VoIP) diagrams, and Action VoIP diagrams with representing voice actions on them, to visualize how the computers interact with callers through voice recognition and dual-tone multi-frequency signaling (DTMF) keypad inputs.
 Cross-Functional Flowcharts
The Cross-Functional Flowcharts solution extends ConceptDraw DIAGRAM software with cross functional flowchart examples, samples, and libraries of cross functional flow chart vector design elements and CH-1 symbols for easy drawing professional-looking and illustrative Cross Functional Flowchart, Cross Functional Diagram, CH-1 Diagram, Process Flowchart, Deployment Flowchart, Opportunity Flowchart, Swimlane Process Mapping Diagram, or Visio Cross Functional Flowchart for planning and further analyzing, optimizing and improvement processes. The use of included pre-made cross functional flowchart template, opportunity flowchart template, and swimlane process map template, greatly easier designing your Cross-functional flowcharts.
Double-headed Cross Functional Flowchart
ConceptDraw DIAGRAM is a powerful tool that helps you create a Cross Functional Flow Chart quickly and easily. Fine-tuning the objects in ConceptDraw DIAGRAM allows you to create a really professional finished article. ConceptDraw Arrows10 Technology gives drawing connectors a smart behavior that provides quick and precise placement, allows for easy changes and automatic rearrangement.Entity Relationship Diagram Examples
ConceptDraw DIAGRAM diagramming and vector drawing software offers the Entity-Relationship Diagram (ERD) Solution from the Software Development Area for ConceptDraw Solution Park. How many examples contains the Entity-Relationship Diagram (ERD) Solution! All Entity Relationship Diagram examples were designed and saved for ConceptDraw DIAGRAM users. Now they are available from ConceptDraw STORE.Audit Process
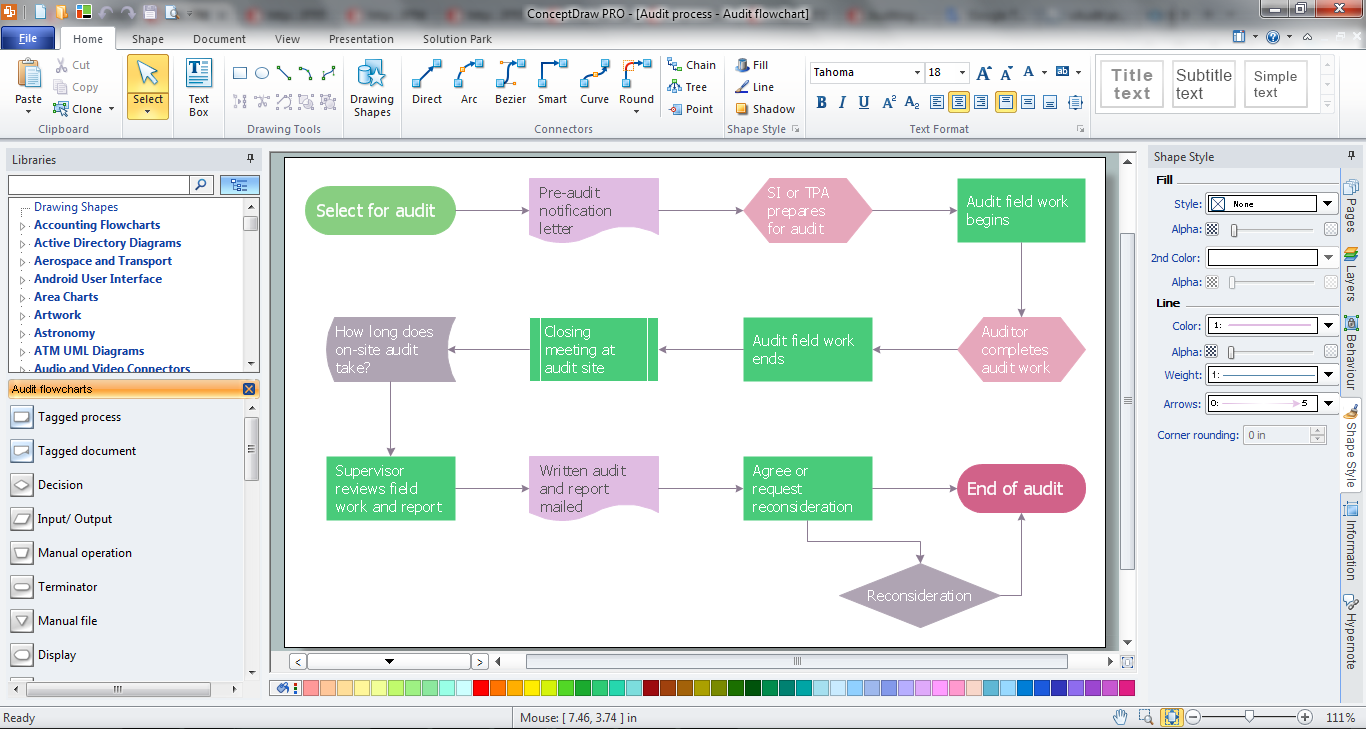
The audit process is a definite set of steps used in a financial, operational or compliance audit. This set of steps depends of the audit services company. The auditing process usually includes three main steps: planning, fieldwork and reporting. The Audit Flowcharts solution from the Finance and Accounting area for ConceptDraw Solution Park extends ConceptDraw DIAGRAM ector graphics and diagramming software with the ability of easy drawing the Audit Process Flowcharts.Basic of Flowchart: Meaning and Symbols
Flowcharts are the best for visually representation the business processes and the flow of a custom-order process through various departments within an organization. ConceptDraw DIAGRAM diagramming and vector drawing software extended with Flowcharts solution offers the full set of predesigned basic flowchart symbols which are gathered at two libraries: Flowchart and Flowcharts Rapid Draw. Among them are: process, terminator, decision, data, document, display, manual loop, and many other specific symbols. The meaning for each symbol offered by ConceptDraw gives the presentation about their proposed use in professional Flowcharts for business and technical processes, software algorithms, well-developed structures of web sites, Workflow diagrams, Process flow diagram and correlation in developing on-line instructional projects or business process system. Use of ready flow chart symbols in diagrams is incredibly useful — you need simply drag desired from the libraries to your document and arrange them in required order. There are a few serious alternatives to Visio for Mac, one of them is ConceptDraw DIAGRAM. It is one of the main contender with the most similar features and capabilities.
Data Model
A data model is what can determine the structure of data as a whole. Different data models can be specified in any data modeling notation, which can be often graphical in its form. Any data model can sometimes also be referred to as a so-called “data structure”. It can especially happen in the context of the different programming languages. Data models can be also often complemented by the different function models, especially in the context of the enterprise ones.
 Business Process Mapping
The Business Process Mapping solution has a collection of vector graphic libraries, pre-made templates, and examples of the business process maps. They are useful for many business specialists including economists, politicians, analysts, and other economic experts, officials and state managers for making the unique and professionally looking drawings. Use it to create an effective Business process map, SIPOC diagram, Swim lanes flowchart and clearly define the necessary business processes due to their inputs and outputs.
- Visio Exchange | Product Overview | How to Send an Outlook Email ...
- Microsoft Exchange - Vector stencils library | Structure Of E Mail With ...
- How to Send an Outlook Email From a Mind Map | How to Add ...
- How to Create a Business Process Workflow Diagram Using ...
- Microsoft Exchange - Vector stencils library | Design elements ...
- ConceptDraw Arrows10 Technology | Microsoft Exchange - Vector ...
- Microsoft Exchange - Vector stencils library | E Mail Structure With ...
- Process Flowchart | Visio Exchange | Email Block Diagram
- Microsoft Exchange | LDAP | Email Structure With Diagram
- How to Send an Outlook Email From a Mind Map | How to Add ...
