This site uses cookies. By continuing to browse the ConceptDraw site you are agreeing to our Use of Site Cookies.
HelpDesk

How To Show Critical Path in ConceptDraw PROJECT Server

The critical path in project management means the picked tasks that influence the start and finish date of a project. Changing date of these selected tasks leads to change of the finish date for the entire project. ConceptDraw PROJECT Server offers a set of tools to track your project tasks, including the possibility to highlight the critical path. Thus you can view, how much a date shift in one task will influence on your project date.

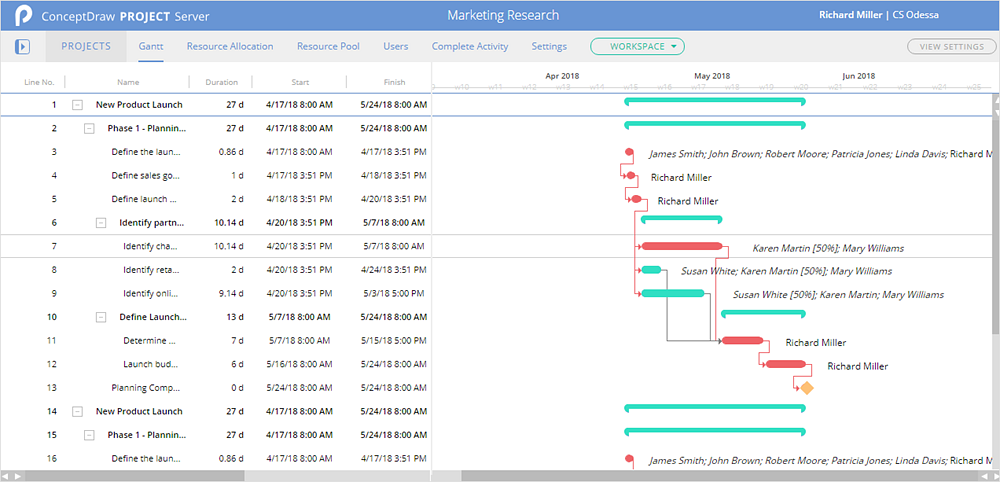
How to Discover Critical Path on a Gantt Chart

ConceptDraw PROJECT is the Gantt chart software that implements critical path method to provide the user with a wide set of project management tools.

Critical Path Method in ConceptDraw PROJECT

The Critical Path Method (CPM) is an algorithm for scheduling a set of project activities. It is an important tool for effective project management. ConceptDraw PROJECT implements this method to provide the user with a wide set of project management tools.

ConceptDraw PROJECT Project Management Software Tool

ConceptDraw PROJECT is simple project management software. If you are on the fast track in your career and start facing such challenges as coordination many people, coordination tasks and works, manage project with a great deal of time and money involved - it is the right time to get Project management tool involved in your work.
HelpDesk

What Information to be Displayed in the ConceptDraw PROJECT Gantt Chart View

What information can contain the project task list? Gantt Chart view is a graphical representation of a project outline that allows one to allocate tasks. You can customize a project’s tasks list view to include the columns you need to meet your information requirements. The columns of the ConceptDraw PROJECT Gantt view contain the information you want to capture about each task in your project. The following article details what information can be contained in the columns of a project outline:<

Program Evaluation and Review Technique (PERT) with ConceptDraw DIAGRAM

Program Evaluation and Review Technique (abbr. PERT) is a method developed by Ministry of Defense of the USA in 1958 for the project of creation the missile system Polaris. PERT diagram is one of the tools for project management that lets greatly simplify the planning and scheduling of large and complex projects. PERT diagram provides evaluation of project run-time and labor forces, it helps to analyze the time necessary for execution each of project tasks and the whole project, and to calculate the project critical path. PERT chart depicts the set of tasks connected each other in order of their execution and is constructed according to one of definite rules - AOA (activity on arrow) or AON (activity on node). It doesn't give you ready concrete decisions, but helps to find them. Design easy the PERT diagrams in ConceptDraw DIAGRAM software enhanced with Seven Management and Planning Tools solution from Management area of ConceptDraw Solution Park. You have a possibility to build the PERT chart of any type, but AON variant is easier for building and perception.

How To create Value Stream Map (VSM)

Value Stream Map template helps you to create VSM diagrams using ConceptDraw DIAGRAM software.

PERT Chart Software

PERT Chart Software - Activity Network and Project Evaluation and Review Technique, or PERT, charts are a way of documenting and analyzing the tasks in a project. ConceptDraw DIAGRAM is a powerful diagramming and vector drawing software for designing professional looking PERT Charts quick and easy.

Advanced printing in ConceptDraw PROJECT

ConceptDraw PROJECT has flexible print settings that allowing you to easily print your project data to suite any need.

CORRECTIVE ACTIONS PLANNING. Risk Diagram (PDPC)

Risk Diagram (PDPC) - ConceptDraw Office suite is a software for Risks Diagram making. This diagram identifies possible risks in accomplishing corrective actions. With the Risks Diagram, one analyzes each action separately in a tree of all actions and develops a preventive action in response of each potential obstacles or circumstances which may be a risk.
7MP Tools
7MP Tools