Sales Process Flowchart. Flowchart Examples
Sales Process Flowchart is an invaluable tool for business. It gives you opportunity to visualise and better understand the sales process, reveal and also visually highlight issues or bottlenecks, and predict the number of sales. The Flowchart is ideal method to represent in details all steps of the process, tasks and decisions needed to obtain maximum effectiveness and success. The steps are graphically represented by boxes linked with arrows indicating direction of the workflow, decision is shown by diamond. The sales process is closely linked to the company's success and usually includes the following main steps: Product knowledge, Prospecting, Planning the sale (Pre-approach), Approach, Need assessment, Presentation, Meeting objections, Gaining commitment, Follow-up. Create fast and easy your own Flowcharts of sales business processes using the ConceptDraw DIAGRAM ector graphic software extended with Cross-Functional Flowcharts solution from Business Processes area and also Sales Flowcharts solution from Marketing area of ConceptDraw Solution Park.Sales Plan
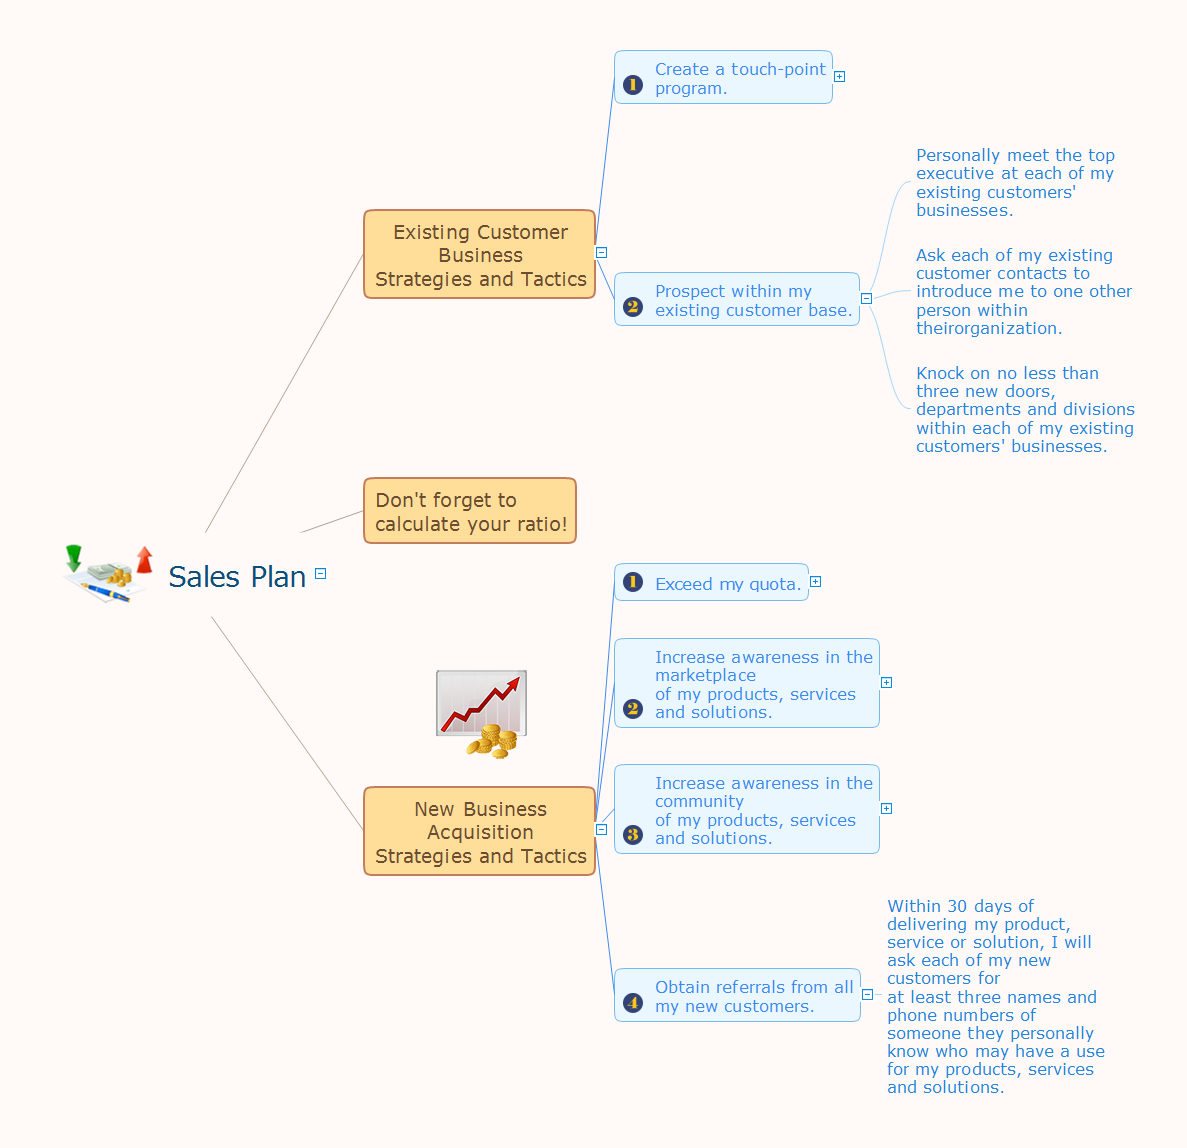
The welfare of the entire company depends on the work of sales department, since the volume of sales sets the level of incomes. The realistic and competently composed sales plan is a component of success, prosperity and stability of the company. The sales plan will help to define specific goal for development of organization for a specified period of time and to define the boundaries of possibilities. The business inevitably faces with various contingencies, but the task of sales department is to maximize the use of existing resources for successful realizing the sales plan. When constructing the sales plan, you should carefully analyze the macroeconomic and political trends, to study the situation on the market and forecasts for dynamics, to take in account the results of competitors, to carefully consider results of work of sales department for the last years and the pace of company's development, to analyze the causes of growth or decline of sales in certain periods. Set the realistic goals and make the sales plan easily in ConceptDraw MINDMAP , don't forget to include to the budget the expenses on sales, such as the costs for advertising, supplies, salaries and bonuses. Save your plan in the form of presentation for easy discussion with other employees of the company.
 Sales Dashboard
Sales Dashboard solution extends ConceptDraw DIAGRAM software with templates, samples and library of vector stencils for drawing the visual dashboards of sale metrics and key performance indicators (KPI).
 Site Plans
The Site Plans solution extends ConceptDraw DIAGRAM with samples, templates and numerous libraries of design elements making it powerful site plan software, ideal for landscape drawing, designing Site Plans, Site Layout Plans, Landscape Design Drawings, Home Site Plans, Hotel Site Plans, Park Site Plans, for developing the residential and commercial landscape design drawings and site plan, parks planning, landscaping territories, lighting trails, for creating drainage facilities, yard layouts, plant maps, outdoor recreational facilities, and irrigation systems plans.
 Computer Network Diagrams
Computer Network Diagrams solution extends ConceptDraw DIAGRAM software with samples, templates and libraries of vector icons and objects of computer network devices and network components to help you create professional-looking Computer Network Diagrams, to plan simple home networks and complex computer network configurations for large buildings, to represent their schemes in a comprehensible graphical view, to document computer networks configurations, to depict the interactions between network's components, the used protocols and topologies, to represent physical and logical network structures, to compare visually different topologies and to depict their combinations, to represent in details the network structure with help of schemes, to study and analyze the network configurations, to communicate effectively to engineers, stakeholders and end-users, to track network working and troubleshoot, if necessary.
Sales Dashboard - insight about potential opportunities and key sales operations
ConceptDraw Sales Dashboard gives you a clear insight about potential opportunities and key sales operations. Analysing sales KPI is a proven way to see how your business can improve.Data Visualization Solutions
Data visualization solutions help you to see how your business can improve. Visualizing sales data using ConceptDraw Sales Dashboard gives you a bird's-eye view of the sale process.Sales Dashboards for Your Company
ConceptDraw DIAGRAM software extended with the Sales Dashboard solution allows you produce sales dashboards for your company easily. You can start from samples and templates delivered with the solution and then modify them to get a dashboard that suites your specific needs.
 Directional Maps
Directional Maps solution extends ConceptDraw DIAGRAM software with templates, samples and libraries of vector stencils for drawing the directional, location, site, transit, road and route maps, plans and schemes.
 Electric and Telecom Plans
The Electric and Telecom Plans solution providing the electric and telecom-related stencils, floor plan electrical symbols and pre-made examples is useful for electricians, interior designers, telecommunications managers, builders and other technicians when creating the electric visual plans and telecom drawings, home electrical plan, residential electric plan, telecom wireless plan, electrical floor plans whether as a part of the building plans or the independent ones.
- Swot Analysis Sales Territory
- The Sales Process | SWOT Sample in Computers | SWOT Analysis ...
- Sales Process Map | Mind Maps for Business - SWOT Analysis ...
- Sales KPI Dashboards | What is a KPI? | The Facts and KPIs | Kpi ...
- https://www.conceptdraw.com/examples/uuo-element daily 0.56 http ...
- Sales Growth. Bar Graphs Example | Create Graphs and Charts ...
- Create Graphs and Charts | Sales Growth. Bar Graphs Example ...
- How to Use ConceptDraw Sales Dashboard Solution | PM ...
- Banquet Hall Plan Software | How To Create Restaurant Floor Plan ...


