Quality issues in heir organization
ConceptDraw Quality MindMap solution is a perfect additional tool for the quality team of your organization.Why do you need the quality management for the organization
You can describe your own quality processes, brainstorm, and structure quality issues; then you can easily and quickly present it to your team. Quality Management Mind Maps - Presentations, Meeting Agendas, Problem will be solved.Quality Improvement
Constant improvement of key performance indicators that are related to quality is a step in the right direction for a company interested in market growth.How to Use Skype for Sharing Documents
Sharing Documents Trough Skype: Share files, manage projects, inspire ideas, connect people.
Org Chart Diagram
ConceptDraw Office products and PM solutions included to ConceptDraw Solution Park support many project methodologies, among them Agile and Simple Projects, which help in implementing the best practices in project management. ConceptDraw Office applications give effective support in solving the issues related with planning, tracking, events, milestones, resource usage, and many other project management functions. ConceptDraw MINDMAP software provides the great advantages of a Mind Map hierarchical tree structure during the process of development the organizational structure of an organization. When you need to make the Organizational Chart, you can use any ConceptDraw DIAGRAM or ConceptDraw MINDMAP software. If you already have a designed Mind Map, it is incredibly easy to generate an Organizational Chart directly from ConceptDraw MINDMAP. You need simply double-click the corresponding icon, all the rest will be made automatically. The Organizational Chart will be created from the active page of your map, outputted to ConceptDraw DIAGRAM and opened in Slideshow mode.Organizational Structure
The organizational structure reflects the composition and hierarchy of company's divisions, determines the distribution of authorities and responsibilities within the organization, and facilitates the understanding by workers their responsibilities. It also defines the group of people making key decisions at the company. Visualization of organizational structure of any company, organization or institution is not an easy task, because sometimes the company may include several departments, each with more than thousand persons. For such large organizations often are created the Organizational charts for every department separately. There are many ways of organization's structuring, which determine its work. Often happens that organizational structure adapts to production process. ConceptDraw DIAGRAM extended with unique Organizational Charts solution from Management area of ConceptDraw Solution Park is a powerful organizational structure software, which ideally suits for developing Organizational Charts of any type and any complexity.Root Cause Tree Diagram
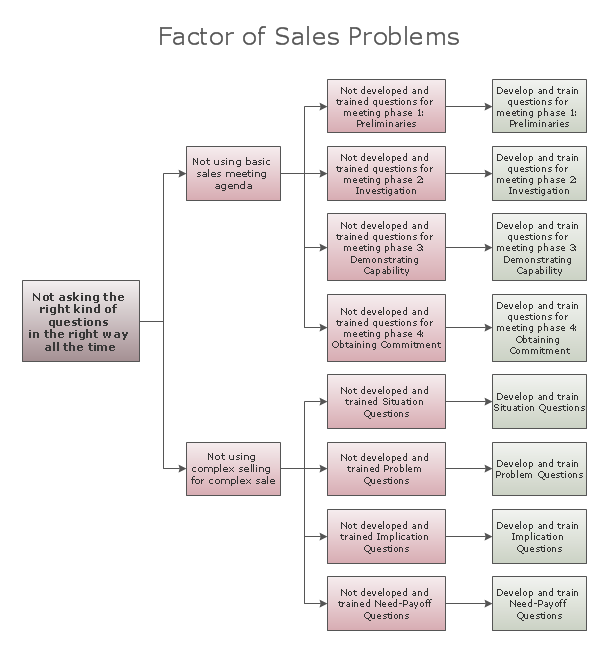
Root Cause Tree Diagram is one of the best tools to outline the problems and their causes, to analyze them and to formulate the possible corrective actions. Root Cause Tree Diagrams are successfully used in management, marketing, quality control and depth analysis, and are based on the principle that solution of any problem is concentrated at the root. Root Cause Tree Diagram contains the main problem on the top, from the top depart two branches of causes, which then diverge on additional causes, thus is constructed the hierarchy of root causes. So, the step by step defining of causes lets to detect the main reasons of a given effect and to make the correct arrangements to solve a problem. The ConceptDraw MINDMAP and ConceptDraw DIAGRAM products included to ConceptDraw Office suite, with help of Business Productivity solutions from the ConceptDraw Solution Park are effective in questions of problem solving, defining root causes of various problems, root causes analysis and designing the Root Cause Tree Diagrams.Organizational Structure Total Quality Management
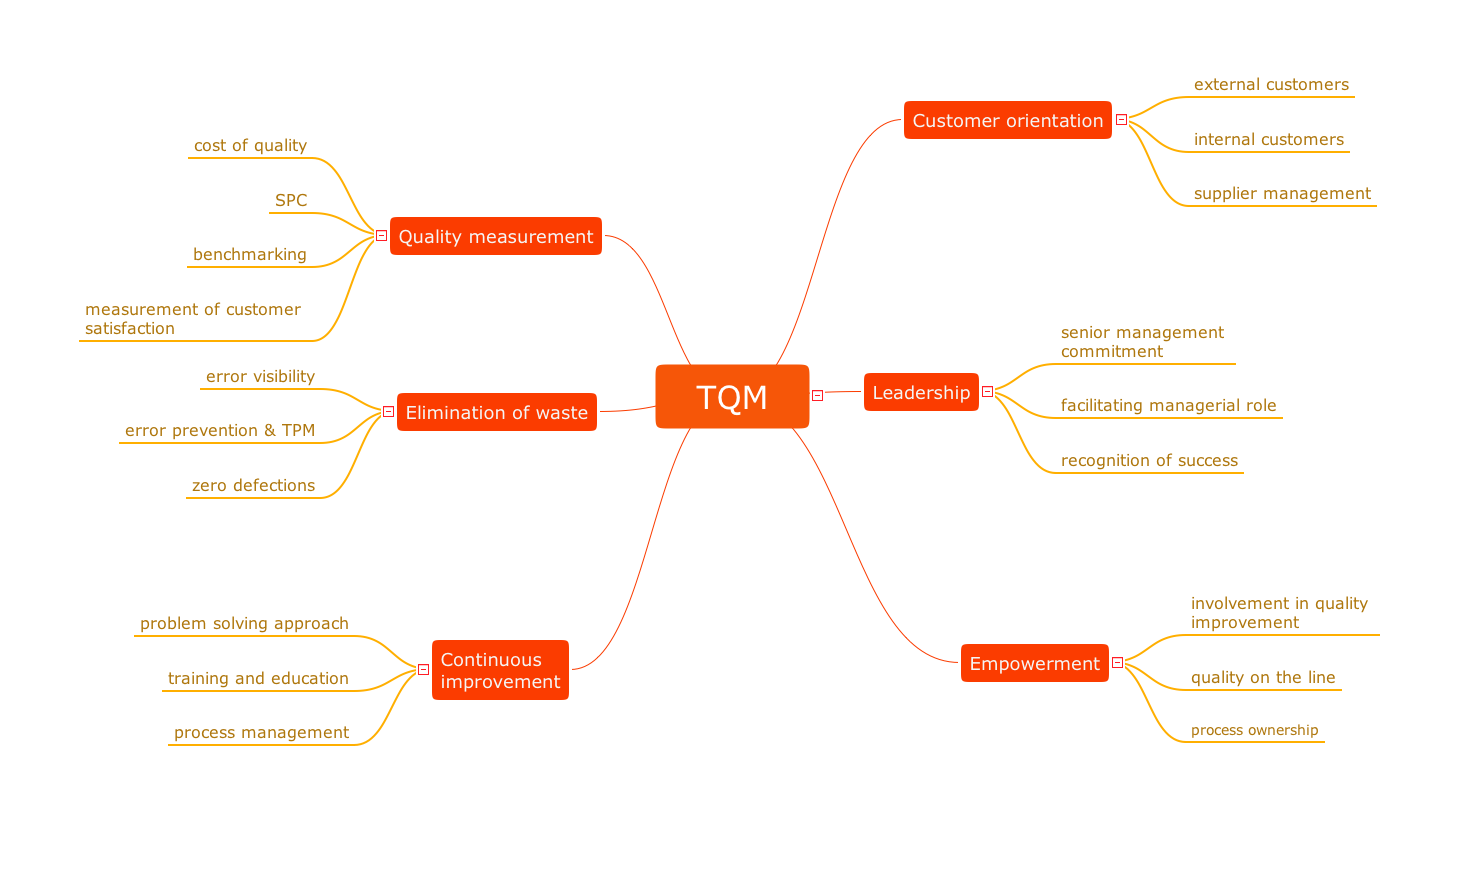
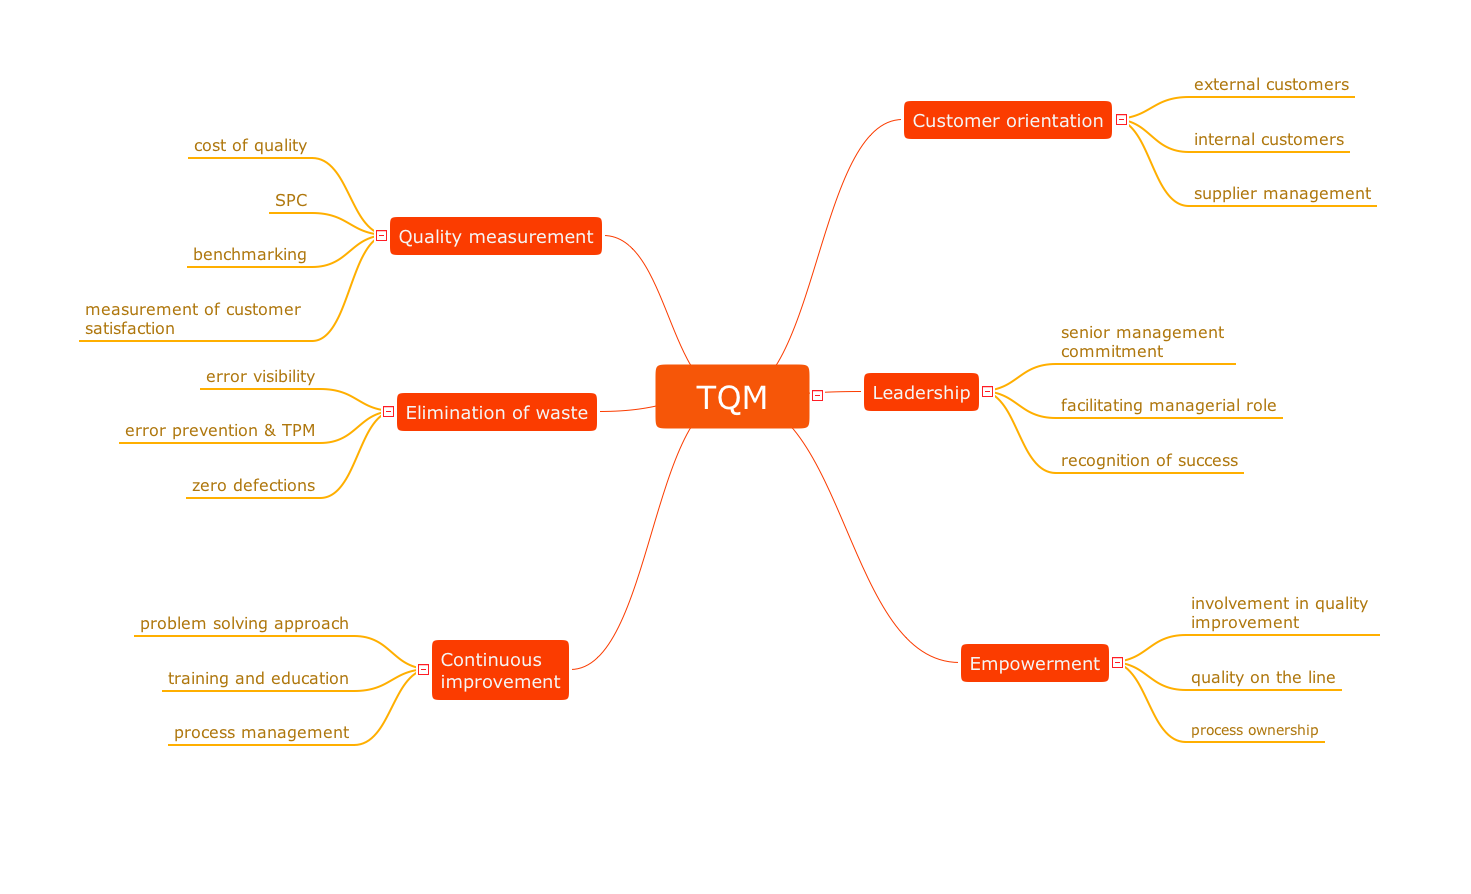
The Total Quality Management Diagram solution helps you and your organization visualize business and industrial processes. Create Total Quality Management diagrams for business process with ConceptDraw software.6 sigma
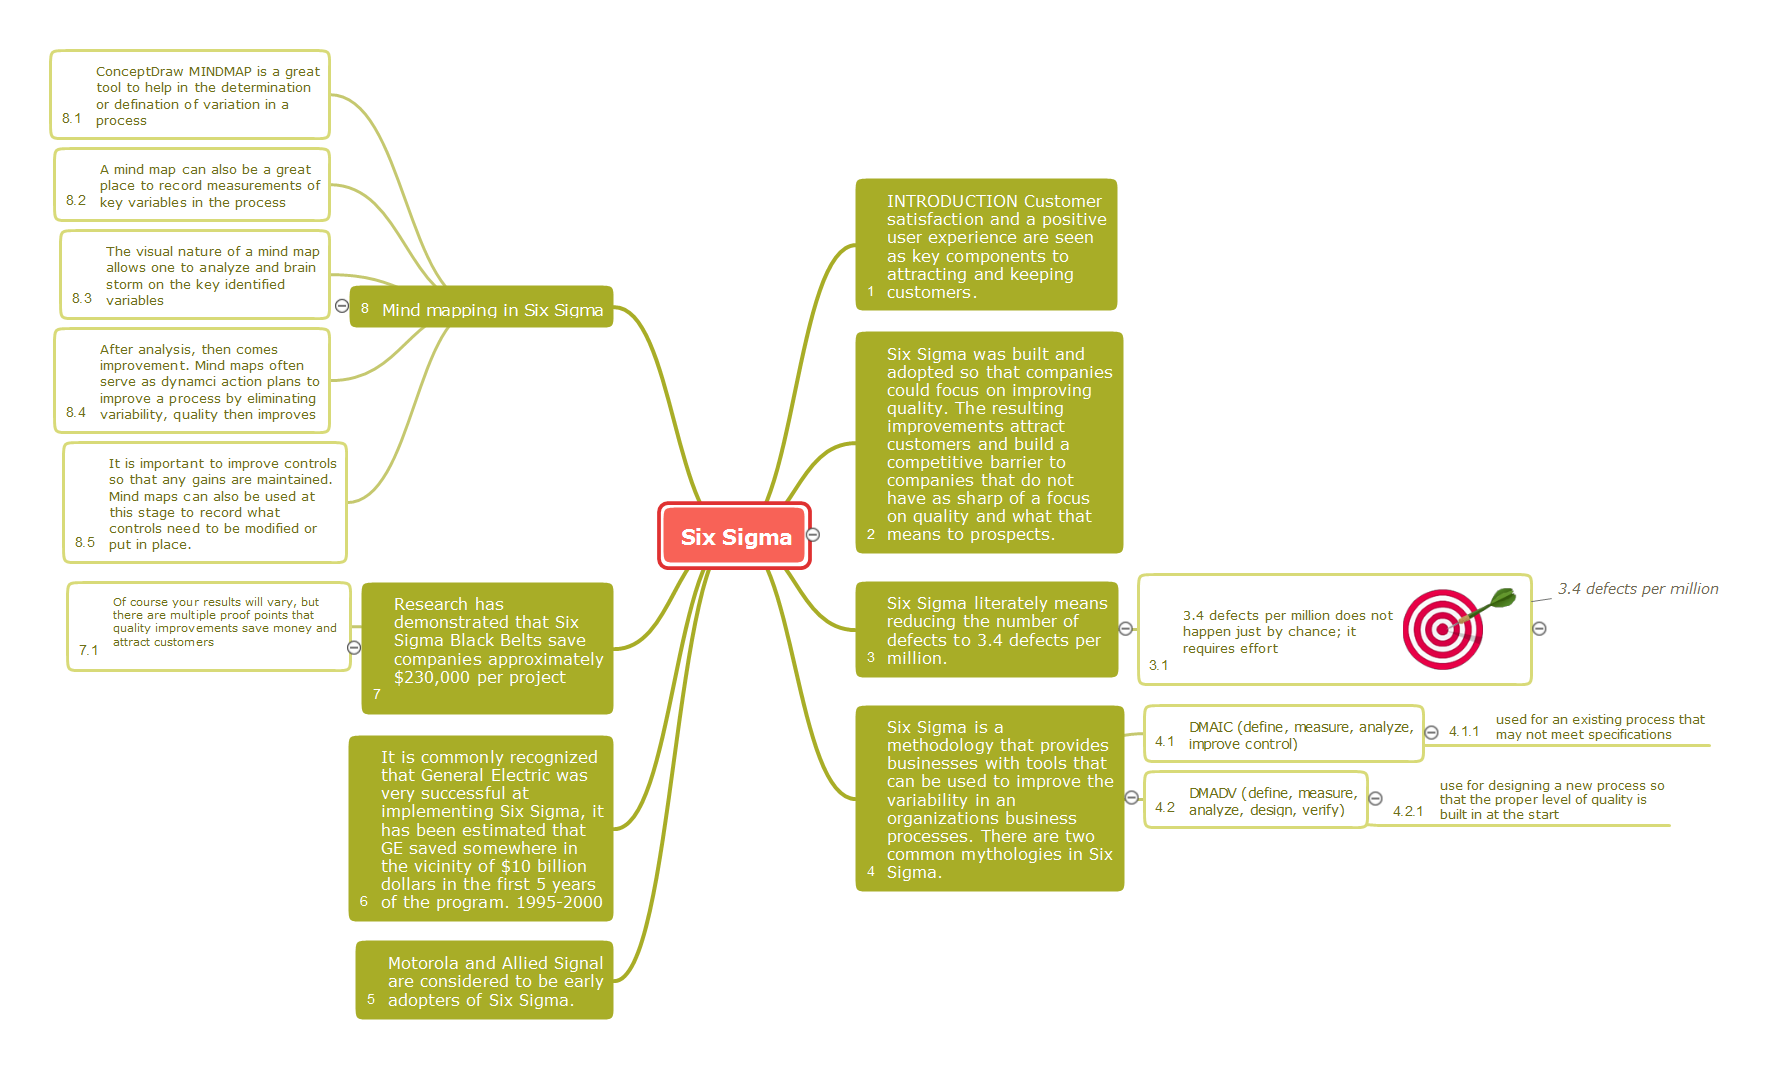
6 Sigma is a popular management concept aimed at improving the quality of work of an organization or individual units and at continuous perfection the processes. The improvement of organization's activities may be executed through the radical changes or in consequence to minor regular improvements. The main purposes of these improvements may be increasing of product safety, improvement quality, decreasing the quantity of defects, shorter the manufacturing cycle, improvement the workplaces, reducing costs, etc. Currently, Six Sigma is applied by organizations of various activity spheres, from the industrial enterprises to the banks. 6 Sigma uses a set of different tools of quality for realizing the improvements and control the processes. Each organization applies its own set of tools, such as Pareto chart, Ishikawa diagram, Tree diagram, etc. Solutions from the Quality area of ConceptDraw Solution Park support quality and manufacturing managers with powerful visualization tools for production quality control and improvement, and supply the ConceptDraw MINDMAP software with Quality Management Mind Maps. This map illustrates how the Six Sigma methodology can be represented as a Mind Map.HelpDesk
How to Make a Mind Map from a Project Gantt Chart
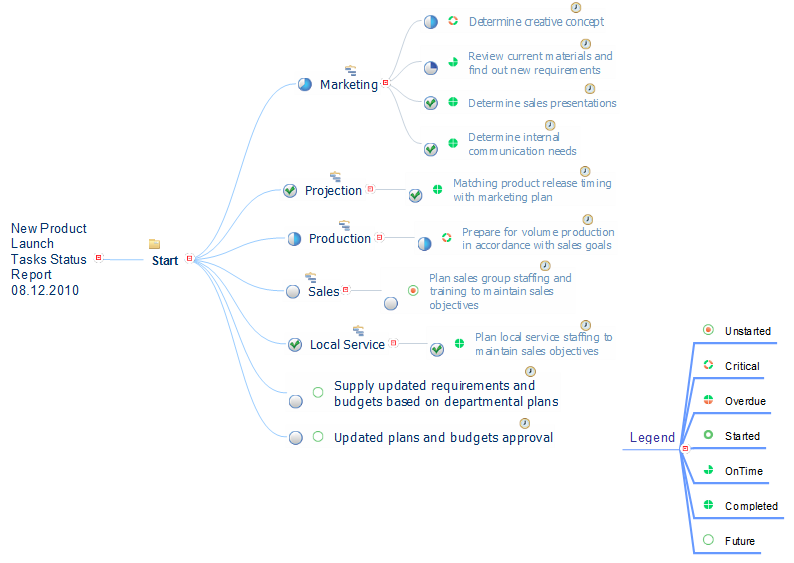
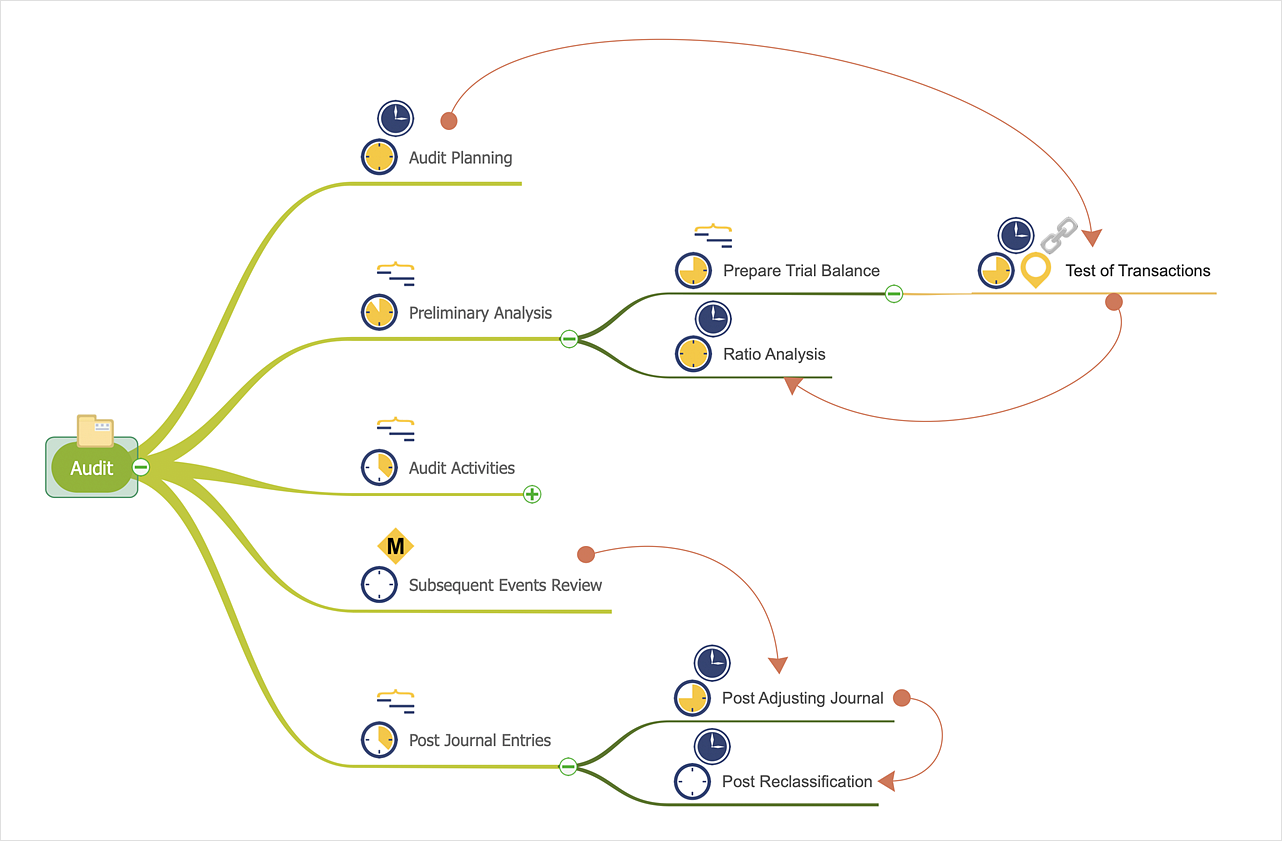
ConceptDraw Office allows you to see the project data from ConceptDraw PROJECT in a mind map structure by opening your project in ConceptDraw MINDMAP.- Mind Map Organizational Chart
- How to Draw a Hierarchical Organizational Chart with ConceptDraw ...
- How to Input Data from MS Excel Into a Mind Map | Risk diagram ...
- Mind Map In A Organization
- How to Input Data from MS Excel Into a Mind Map | Create ...
- Mind Map Chart Of Organisation
- Data structure diagram with ConceptDraw PRO | Visio Files and ...
- Mindmap Organizational Chart
- How to Input Data from MS Excel Into a Mind Map | How to Convert a ...
- Mindmap Format Of Organisation Chart
