Probability Quality Control Tools
The Total Quality Management Diagram solution helps your organization visualize business and industrial processes. Create Total Quality Management diagrams for business process with ConceptDraw software.Total Quality Management Value
The Total quality management (TQM) is an enterprise-wide method of continuous quality improvement of all organizational processes, including the enhancement of ability to deliver high-quality products and services to the customers. The TQM includes eight main elements, which have great value: customer-focused, process-centered, total employee involvement, integrated system, continual improvement, strategic and systematic approach, fact-based decision making, communications. ConceptDraw PRO diagramming and vector drawing software offers the Total Quality Management Diagram solution with effective drawing tools, predesigned vector elements, samples and templates that help easy design the Total Quality Management diagrams, TQM flowcharts and Mind Maps widely used in quality management projects to visualize the business processes and industrial processes for your organization, to demonstrate the quality control step-by-step in a visual manner, to compare visually the ideal and real stages of processes.Identifying Quality Management System
The Total Quality Management Diagram solution helps your organization visualize business and industrial processes. Create Total Quality Management diagrams for business process with ConceptDraw software.
 Seven Basic Tools of Quality
Manage quality control in the workplace, using fishbone diagrams, flowcharts, Pareto charts and histograms, provided by the Seven Basic Tools of Quality solution.
Value-Stream Mapping for Manufacturing
Create value stream maps - for value stream analysis and value stream management, material and information flow mapping, using our quick start templates included with ConceptDraw.Steel Presentation
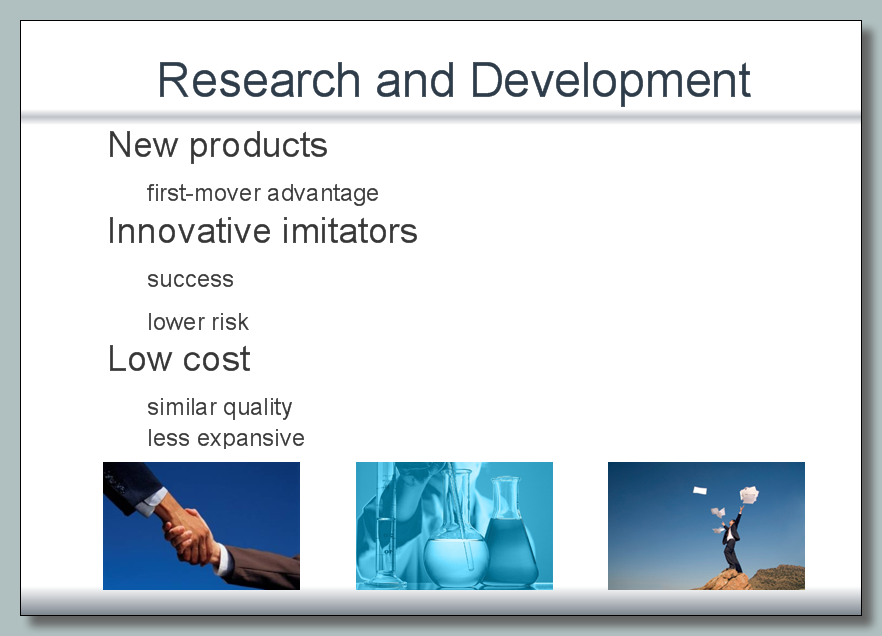
The presentation clearly shows the attractiveness of the project, product or service, its strengths, the irrefutable advantages and compelling arguments. The success of presentation depends on the competent combination of text with high-quality visual design. It is recommended to represent a moderate amount of text and supplement it by attractive and stylish images, photos, graphs and diagrams. However, they do not necessarily have to be bright, in some cases vice versa is appropriate to withstand a discreet, strict and business steel style, especially when you need that design of presentation did not distract from the main content of the project. The background should have the soothing color shade, which will not prevent to perception of information, and the font should to be large and clear, without unnecessary fanciful elements. ConceptDraw MINDMAP software lets create attractive Mind Maps and ConcepDraw PRO software helps design professional-looking diagrams, infographics and illustrations, that you can then output in one click to MS Power Point presentation. Create quickly and easily the most informative and memorable presentations with ConceptDraw Office applications.Process Flowchart
The main reason of using Process Flowchart or PFD is to show relations between major parts of the system. Process Flowcharts are used in process engineering and chemical industry where there is a requirement of depicting relationships between major components only and not include minor parts. Process Flowcharts for single unit or multiple units differ in their structure and implementation. ConceptDraw PRO is Professional business process mapping software for making Process flowcharts, Process flow diagram, Workflow diagram, flowcharts and technical illustrations for business documents and also comprehensive visio for mac application. Easier define and document basic work and data flows, financial, production and quality management processes to increase efficiency of your business with ConcepDraw PRO. Business process mapping software with Flowchart Maker ConceptDraw PRO includes extensive drawing tools, rich examples and templates, process flowchart symbols and shape libraries, smart connectors that allow you create the flowcharts of complex processes, process flow diagrams, procedures and information exchange. Process Flowchart Solution is project management workflow tools which is part ConceptDraw Project marketing project management software. Drawing charts, diagrams, and network layouts has long been the monopoly of Microsoft Visio, making Mac users to struggle when needing such visio alternative like visio for mac, it requires only to view features, make a minor edit to, or print a diagram or chart. Thankfully to MS Visio alternative like ConceptDraw PRO software, this is cross-platform charting and business process management tool, now visio alternative for making sort of visio diagram is not a problem anymore however many people still name it business process visio tools.
Seven Basic Tools of Quality — Quality Control
ConceptDraw PRO diagramming and vector drawing software extended with Seven Basic Tools of Quality solution from the Quality area of ConceptDraw Solution Park provides effective tools for quality control and helps design any types of quality-related diagrams.Quality Control
Quality control can separate the act of testing different products for uncovering the defects from the decision in order to deny or allow any product release, which may be determined by different fiscal constraints. Quality control issues are known to be among the top reasons for not renewing the contracts and, thus, they have to be taken into consideration while working on some project.Internal Audit Process
Internal auditing is an independent, objective assurance and consulting activity designed to add value and improve an organization's operations. ConceptDraw PRO diagramming and vector drawing software extended with Audit Flowcharts solution from the Finance and Accounting area perfectly suits for the Internal Audit Process. You can make sure this right now!- Total Quality Management Value | Probability Quality Control Tools ...
- Quality Control | Value-Stream Mapping for Manufacturing | TQM ...
- Total Quality Management Value | Fishbone Diagram | 4ms Of ...
- Mind Map Quality Control Diagram
- Seven Basic Tools of Quality - Quality Control | Workflow Diagram ...
- Quality Mind Map | TQM Diagram Example | Group Collaboration ...
- Block Diagram Of Quality Assurance
- Total Quality Management TQM Diagrams
- Block Diagram Of Quality Control
- Fishbone Diagrams | Fish Bone Diagram In Quality Management


