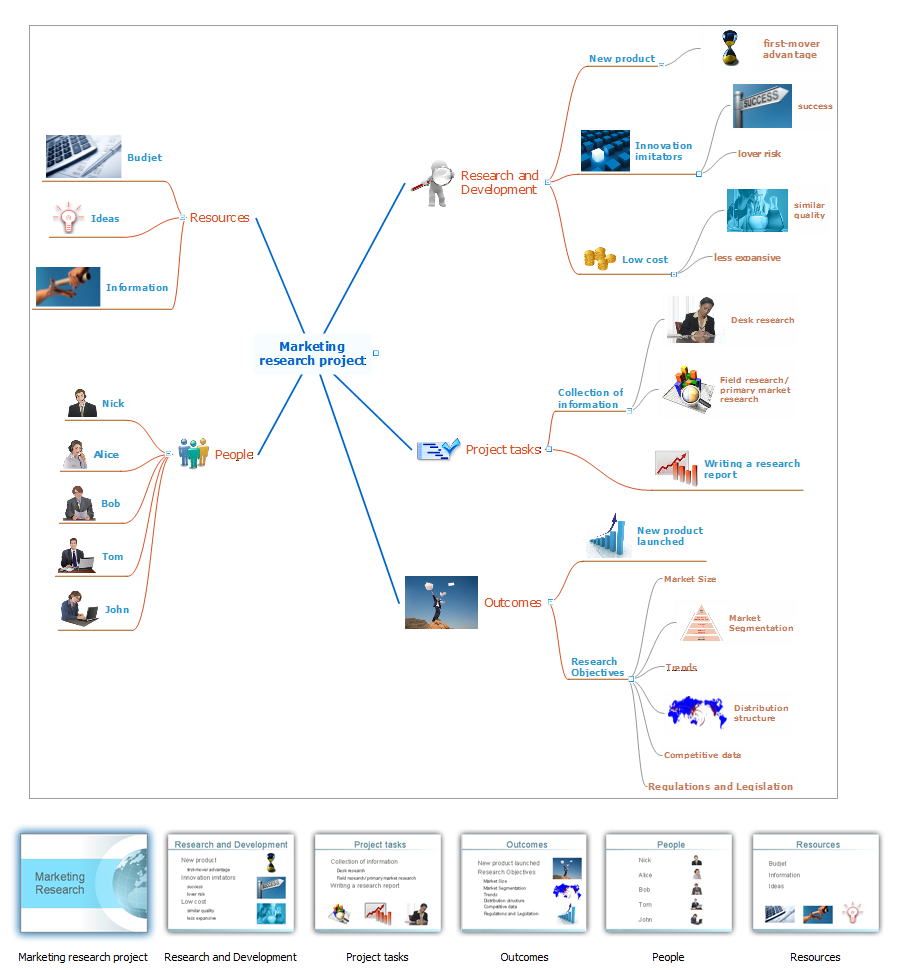
Creating a default presentation in ConceptDraw MINDMAP
ConceptDraw MINDMAP a versatile, yet easy-to-use tool for organizing ideas and data. Creates mind maps that intuitively illustrate your thought process. Outputs a wide variety of document styles and formats. Delivers presentations from mind maps with built-in modes and MS PowerPoint export. Perfect for brainstorming, project planning, meeting management, note taking, and more.Geo Map — Australia — New Zealand
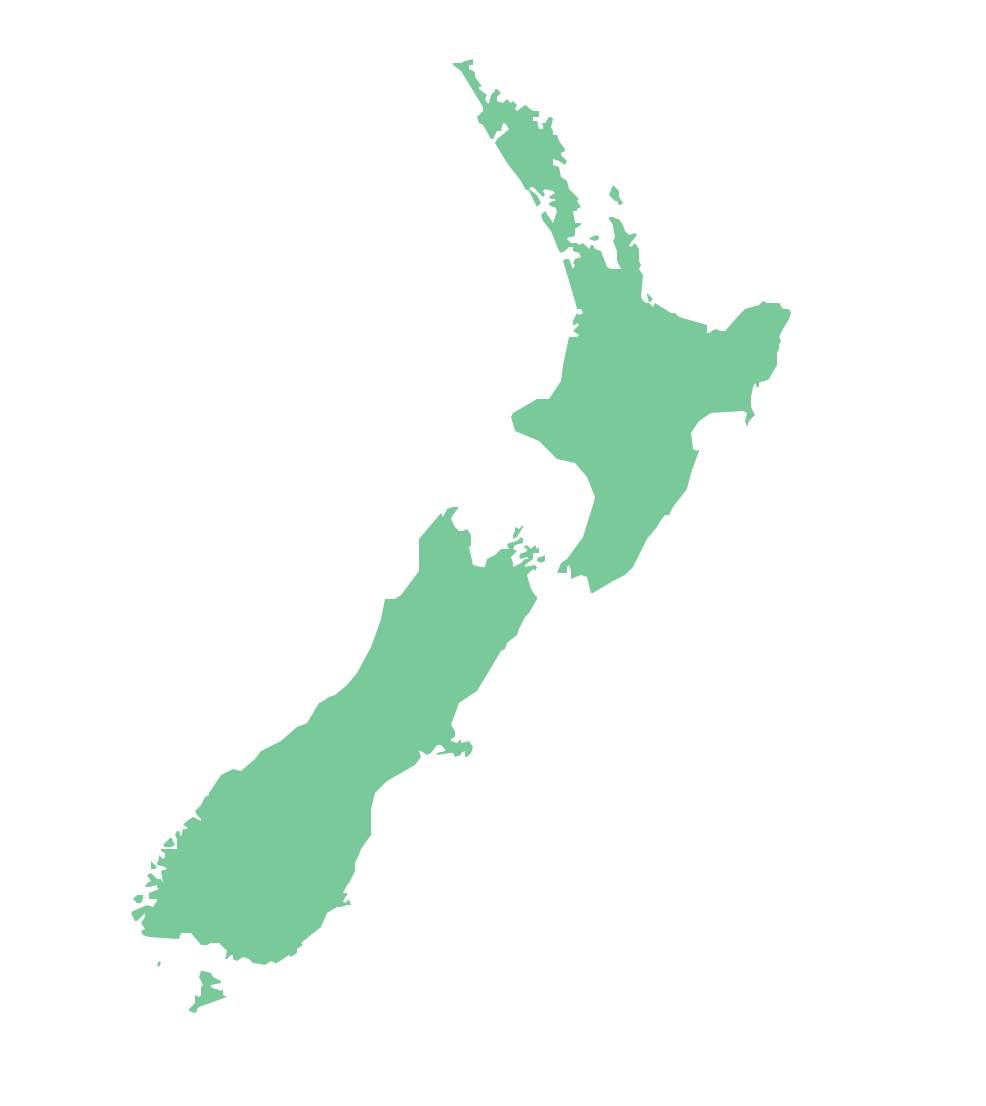
The vector stencils library Australia contains contours of New Zealand and Australian states and mainland territories for ConceptDraw DIAGRAM diagramming and vector drawing software.Geo Map - Australia - South Australia
South Australia (abbreviated as SA) is a state in the southern central part of Australia. It covers some of the most arid parts of the continent.Geo Map - Australia - Queensland
Queensland (abbreviated as QLD) is the second-largest and third-most populous state in Australia.Geo Map - Australia - Western Australia
Western Australia (abbreviated as WA) is a state occupying the entire western third of Australia.Purchase Process Flow Chart, Receiving Process Flow Chart, Accounting Flowchart Example.
The purchasing process follows very specific guidelines and includes a purchasing cycle flowchart and receiving process flow chart. Common key elements of purchasing process. It is important to know how purchasing processes work and how each operation is done.Geo Map - Australia
The vector stencils library Australia contains contours of New Zealand and Australian states and mainland territories for ConceptDraw DIAGRAM diagramming and vector drawing software.Is ConceptDraw DIAGRAM an Alternative to Microsoft Visio?
Visio for Mac and Windows - ConceptDraw as an alternative to MS Visio. ConceptDraw DIAGRAM delivers full-functioned alternative to MS Visio. ConceptDraw DIAGRAM supports import of Visio files. ConceptDraw DIAGRAM supports flowcharting, swimlane, orgchart, project chart, mind map, decision tree, cause and effect, charts and graphs, and many other diagram types.Pyramid Chart Examples
Pyramid Charts and Triangle Diagrams are used to visually structure the topics and progressively order the quantitative data. They allow to illustrate hierarchical structure of the topics, proportional, interconnected and containment relations among the topics. The multilevel Pyramids and Triangle diagrams are constructed oriented up or down and divided into several horizontal slices. They are effectively used to represent marketing strategies, social strategies, information systems, market value, etc., to illustrate presentations, websites, documents, reports in business, finances, sales, management, marketing, media, training, consulting, and many other fields. To maximize the efficiency in drawing the Pyramid Charts, use the ConceptDraw DIAGRAM diagramming and vector drawing software extended with Pyramid Diagrams solution from Marketing area, which contains the set of Pyramid Chart examples, samples, templates and vector design elements of triangular diagrams and pyramids with different quantity of levels for various needs.Pyramid Diagram
ConceptDraw Pyramid Diagram software allows drawing column charts using predesigned objects or drawing tools.GUI Software
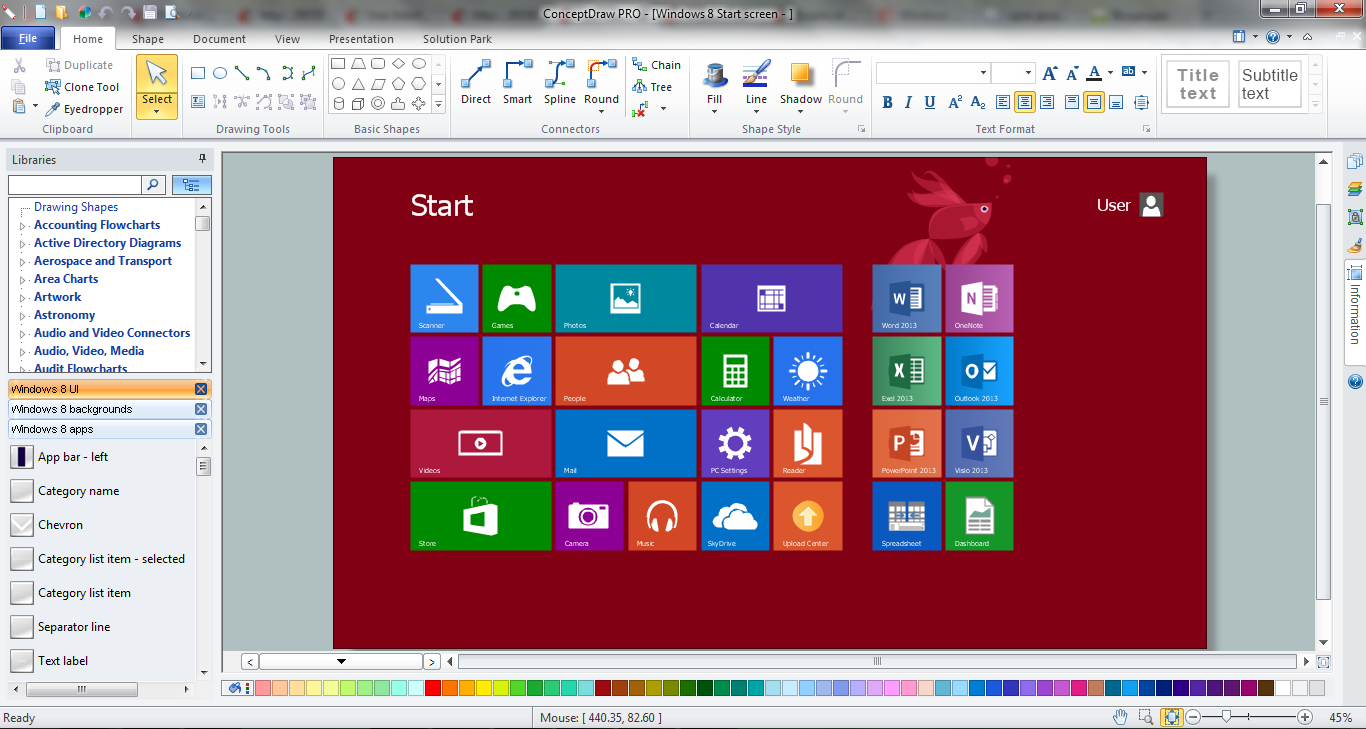
ConceptDraw DIAGRAM diagramming and vector drawing software extended with Windows 8 User Interface Solution is a powerful GUI Software. Designing of professional looking Windows 8 and Windows 8.1 user interfaces, and Windows 8 UI design patterns never been easier than now with convenient and useful tools of Windows 8 User Interface Solution from the Software Development area.Diagramming Software for Design UML Object Diagrams
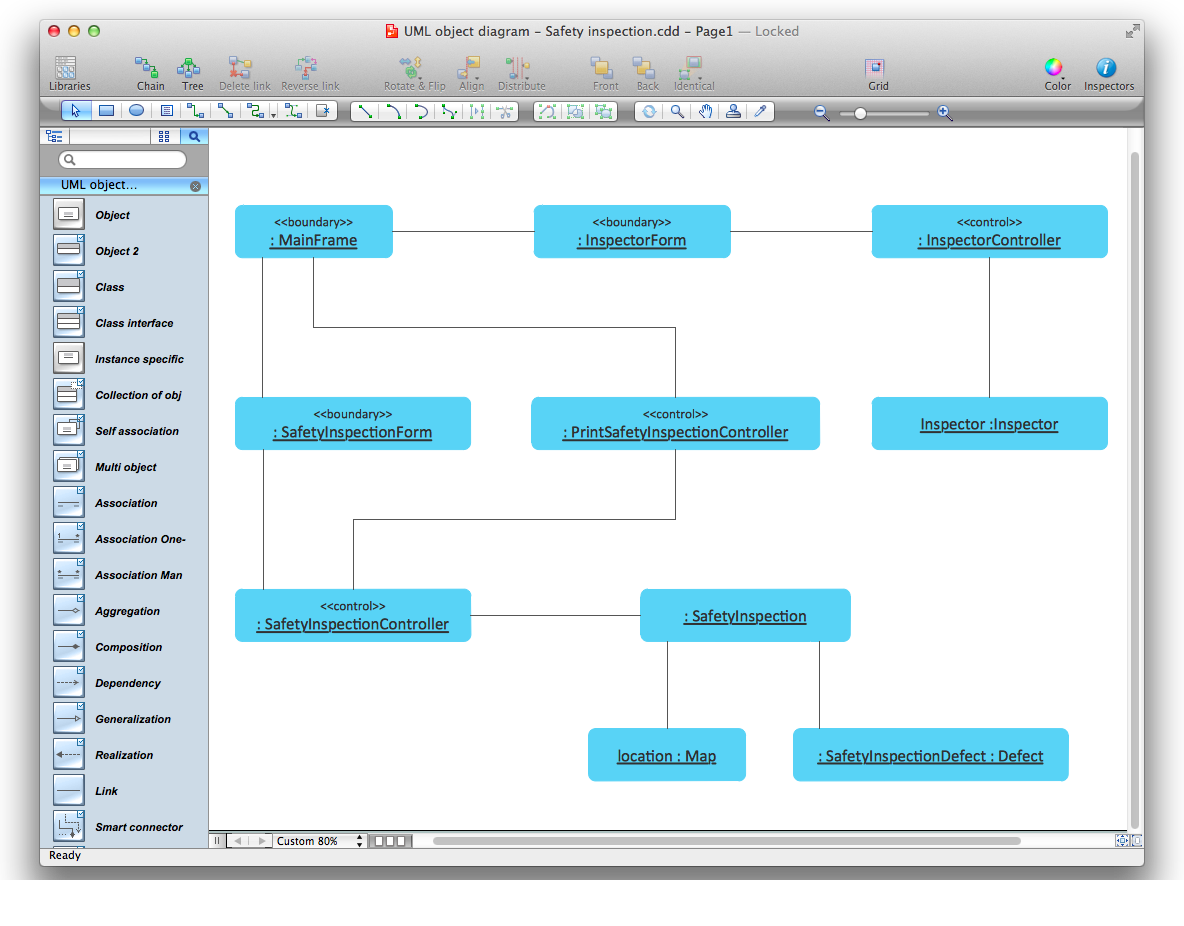
UML Object Diagram shows the structure of a modeled system at a specific time. ConceptDraw Rapid UML solution delivers libraries contain pre-designed objects fit UML notation, and ready to draw professional UML Object Diagram.
Business Processes
The most worked out and commonly used methodology of business processes description is IDEF methodology. Besides business processes it allows to describe functional blocks, for example production and marketing. ConceptDraw lets creation of business processes description using IDEF0 and IDEF2 methods.Pyramid Diagram
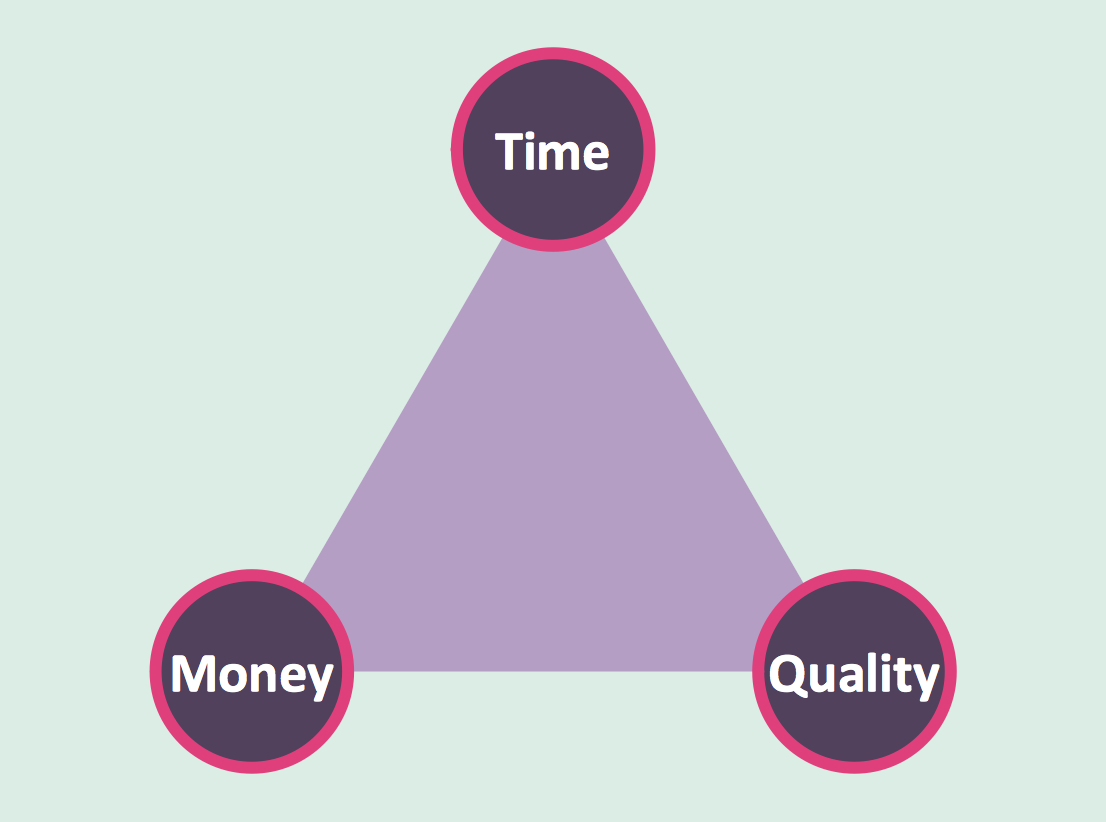
The Time-Money-Quality Triangle illustrates an advertising truism, that you can't have all three.Pyramid Diagram
A triangular graphic representing Graham's "hierarchy of disagreement", based on Paul Graham's March 2008 essay "How to Disagree".- Quality Project Management with Mind Maps | How To Implement ...
- Basic Diagramming | Concept Maps | Mathematics | Concept ...
- Quality Mind Map | Easy Flowchart Program and Standard Flowchart ...
- Flow Chart Of Market Research Process In Sa
- Think and act effectively | Percent of students achieved a 36 on ACT ...
- Value Stream Mapping For Customer Service
- Microsoft Azure | How to Insert a Mind Map into Microsoft Word ...
- How to Convert a Mind Map into MS Word Document | Local area ...
- Value stream map parts
- Business Process Modeling Notation | How to show a mind map ...
- Concept Map | How to Draw a Mind Map on PC Using ConceptDraw ...
- Geo Map - Asia | Geo Map - Asia - Malaysia | How To Do A Mind ...
- Seven Continents Map
- Chen's ERD of MMORPG | Entity Relationship Diagram Software for ...
- Business People Figures | Sun Solar System | Astronomy and ...
- Demonstrating Results | How To Use Skype for Business | Sochi ...
- Value-Stream Mapping for Manufacturing | Process Flowchart | Lean ...
- Concept Maps | Concepts and relationship in the geopolitical ...
- Solar system
