How To Show Project Progress Peport on Web
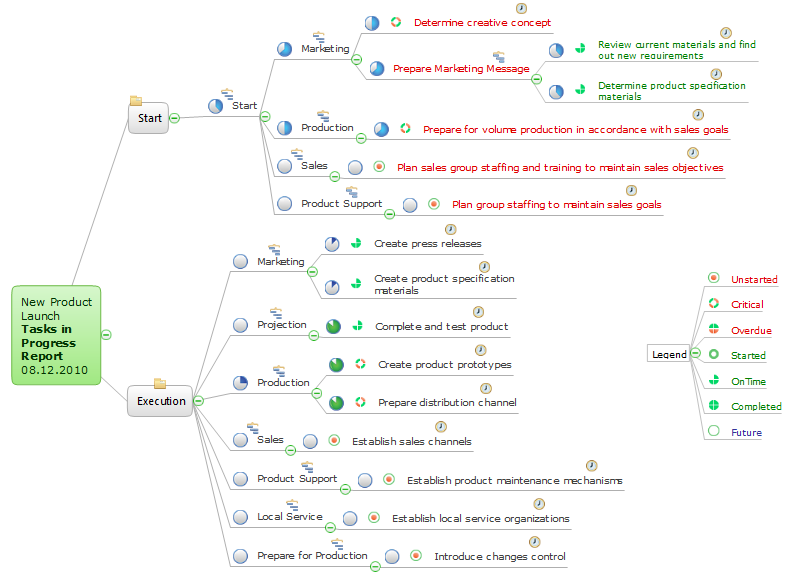
Project progress on web: delivering project status to remote teams and stakeholders via Skype.
ConceptDraw PROJECT Project Management Software Tool
ConceptDraw PROJECT is simple project management software. If you are on the fast track in your career and start facing such challenges as coordination many people, coordination tasks and works, manage project with a great deal of time and money involved - it is the right time to get Project management tool involved in your work.Gantt Chart Software
ConceptDraw PROJECT is a powerful Gantt Chart Software. The Gantt Charts are useful for displaying a large amount of detailed information, project tasks and timelines in a visually pleasing, easy-to-understand format. ConceptDraw PROJECT provides wide capabilities of importing and exporting in various formats: Microsoft Project, ConceptDraw MINDMAP , Mindjet MindManager, PDF file.Presenting a Slide Show to a Group of People
Tips on how to present a slide show to a group. Deliver a successful presentation to your team.
Project — Working With Costs
ConceptDraw PROJECT delivers a rich set of built-in functionalities and optional product extensions that support your daily workflow in time-saving and creative ways. This video lesson will teach you how to work with costs in your project document.Export from ConceptDraw MINDMAP to Apple iCal
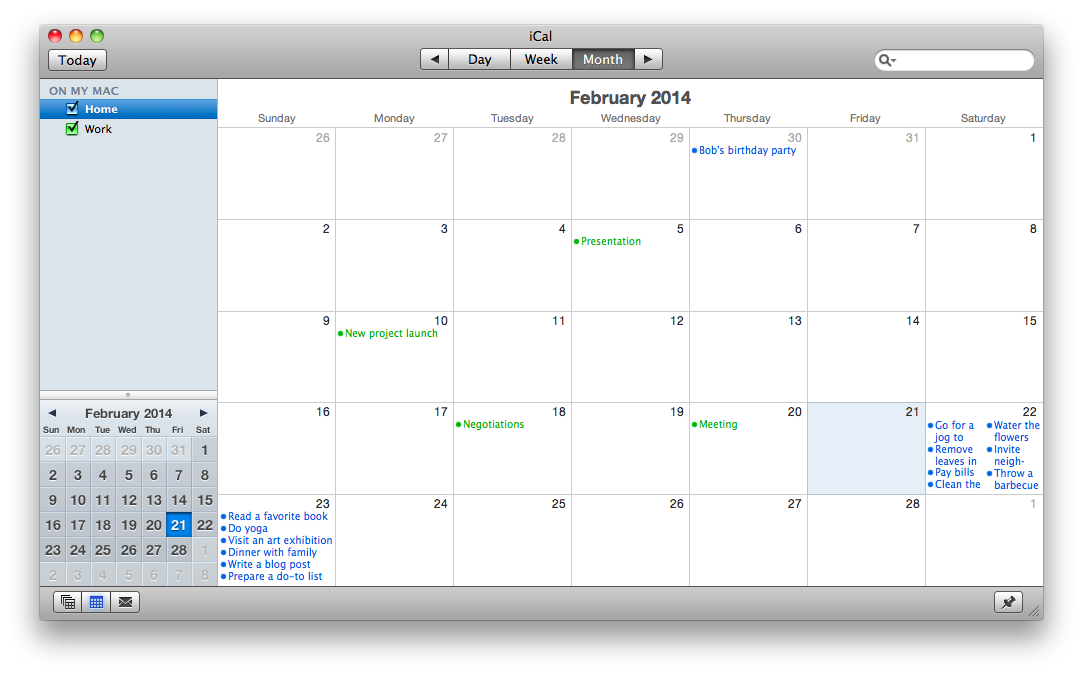
ConceptDraw MINDMAP Mac OS X version enables you to export your mind map into the iCal calendar and generate tasks from mind map topics.Skype Presentation
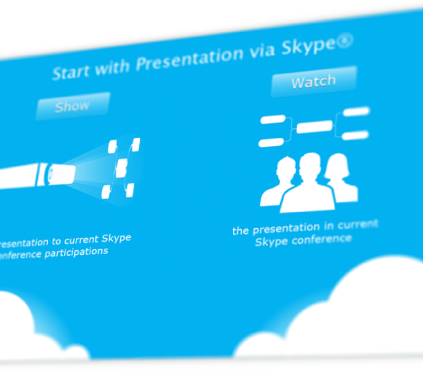
How to do Skype Presentation. Solution for ConceptDraw MindmapCreate Response Charts
Visual navigation through the stages of a response process helps you locate specific actions to be taken via Action Mind Maps. Use ConceptDraw DIAGRAM and ConceptDraw MINDMAP for organize the process of response for interactions occurring in social media.Flow Diagram Software
The diagram is a convenient way of representing complex information and data in a simple, visual and comprehensive form. There are used many types of diagrams, each of them has its own fields of application. Flow diagram is a diagram that illustrates the flow or set of dynamic relationships in a system, visually depicts the structure of the elements in a complex system and their interactions. The term Flow diagram is also synonym for a Flowchart. Flow Diagrams are the perfect way to visually represent the structural data. ConceptDraw DIAGRAM extended with Flowcharts solution from the Diagrams area is a professional flow diagram software. The basic set of vector stencils libraries offered by Flowcharts solution, variety of samples and templates developed by specialists, and also advanced RapidDraw technology open before ConceptDraw users wide opportunities in representing the flow processes, in drawing Flow Diagrams and Flowcharts of any type and complexity. Easy tools of exporting to different graphical formats give the possibility of further successful use the diagrams.Gantt chart examples
All Gantt charts were made using ConceptDraw PROJECT. ConceptDraw PROJECT works both on Windows and Mac OS X. It allows to schedule a voluntary number of projects in a single Workspace document and lets easily share tasks and resources among them. ConceptDraw PROJECT shares files among Windows and Mac OS X.- Mindmap Online Gantt Chart Free
- Gantt Chart Generator
- How to Make a Mind Map from a Project Gantt Chart | How to Quickly ...
- How to Make a Mind Map from a Project Gantt Chart | How To ...
- ConceptDraw Software Full Versions Free Download | Flowchart ...
- Free Team Gantt Chart
- How to Make a Mind Map from a Project Gantt Chart | How to Create ...
- Gantt Chart Online Free Creator
- Gantt charts for planning and scheduling projects | Gant Chart in ...
- How to Create Presentation of Your Project Gantt Chart ...


