This site uses cookies. By continuing to browse the ConceptDraw site you are agreeing to our Use of Site Cookies.
HelpDesk

How to Generate Tabular Reports in ConceptDraw PROJECT for macOS

Project reporting is one of the key functions of effective project management. Using regular project reports, a project manager can constantly track and analyze the project’s execution. This analytic process can help to ensure that the team reaches the best possible solutions. ConceptDraw PROJECT is a professional software tool for project management with the advanced mechanism of reporting. You can create the set of regular reports on project activities, task statuses, cash flow and assignments in MS Excel format. Mind map reports are also available.
HelpDesk

How to Change the Timescale in a Gantt Chart View

Most views in ConceptDraw PROJECT Server have a timescale that shows the units of project time measurement (hour, day, week, etc.) used to schedule project tasks. You can change the timescale to view smaller or bigger time units, from hours all the way up to years. For example, you may want to show time in quarterы of the yearб or you may want to show a Gantt chart across months and days.

Computer Hardware - Reseller Business Plan

A more detailed mind map of a business plan for a computer hardware reseller.

Business Productivity - Marketing

To support you in your tasks you can use the power of ConceptDraw DIAGRAM providing
intelligent vector graphics that are useful for marketing diagramming and
ConceptDraw MINDMAP for key marketing mind maps.

Donut Chart Templates

These donut chart templates was designed using ConceptDraw DIAGRAM diagramming and vector drawing software extended with Pie Charts solution from Graphs and Charts area of ConceptDraw Solution Park.
All these donut chart templates are included in the Pie Charts solution.
You can quickly rework these examples into your own charts by simply changing displayed data, title and legend texts.

SWOT Template

The "SWOT Analysis" solution gives simple visual support for all the steps of a SWOT Analysis process. SWOT analysis is a strategic planning method used to evaluate the Strengths, Weaknesses, Opportunities, and Threats facing a project. The new template for ConceptDraw MINDMAP isually supports identifying internal and external factors that are favorable and unfavorable. When the analysis is complete, output your data to a SWOT Matrix in ConceptDraw DIAGRAM for exporting to a variety of other formats: MS Visio, PowerPoint presentation, PDF, image files, etc.

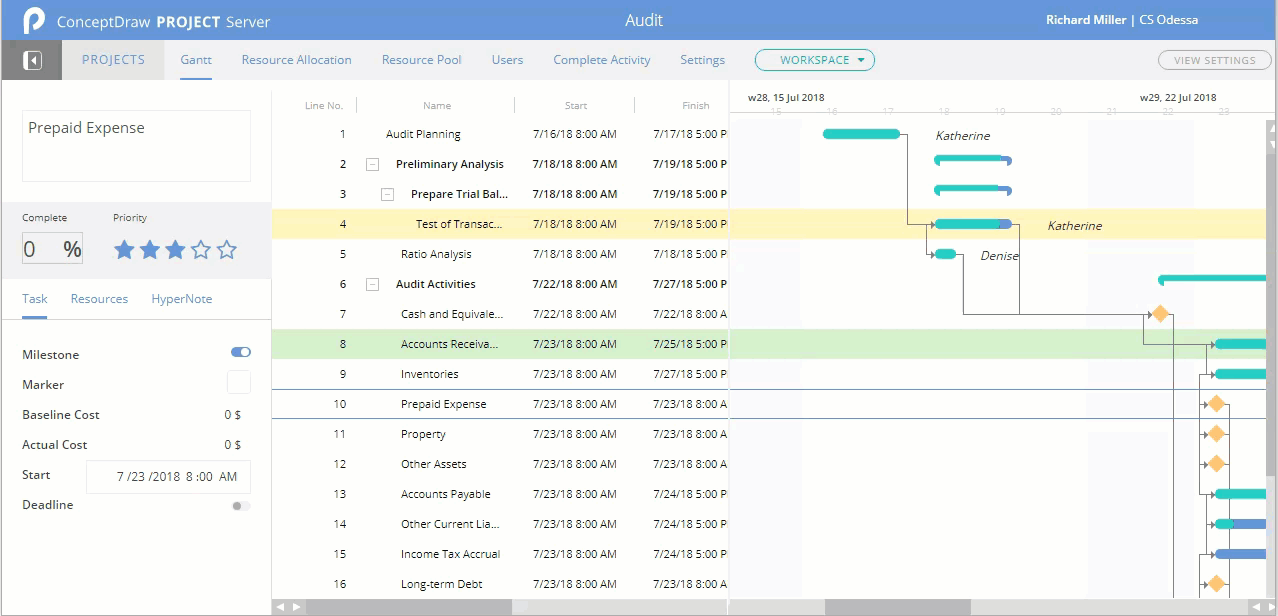
Project — Working With Tasks

A full-featured project management solution with all the necessary functions right at your fingertips. Generates an extensive variety of reports on project and task statuses.
These videos provide a series of lessons that will enhance the understanding of all our users, from people just starting out with the software, through to expert users.

Timeline Examples

ConceptDraw DIAGRAM diagramming and vector drawing software offers the Timeline Diagrams solution from the Management area which is rich for the timeline examples, samples, templates and ready-to-use vector shapes.

Bar Diagrams for Problem Solving. Create event management bar charts with Bar Graphs Solution

Create bar charts for event management problem solving and visual data comparison using the ConceptDraw DIAGRAM diagramming and vector drawing software extended with the Bar Graphs Solution from the Graphs and Charts area of ConceptDraw Solition Park.

Business Calendar

Business calendar is a special type of calendar, it must be functional, convenient for scheduling the affairs and meetings, and also must have strict, official and unobtrusive interface. So you must pay special attention to the business calendar design. Now you don't need to be an artist to design business calendar thanks to the unique drawing tools of Calendars Solution for ConceptDraw DIAGRAM diagramming and vector drawing software.