Best Mind Mapping Program for Making Presentations
ConceptDraw MINDMAP with the ability to import presentations from Microsoft PowerPoint, as well as enhancing its existing presentation capabilities.Why do you need the quality management for the organization
You can describe your own quality processes, brainstorm, and structure quality issues; then you can easily and quickly present it to your team. Quality Management Mind Maps - Presentations, Meeting Agendas, Problem will be solved.HelpDesk
How to Create Organizational Chart Quickly
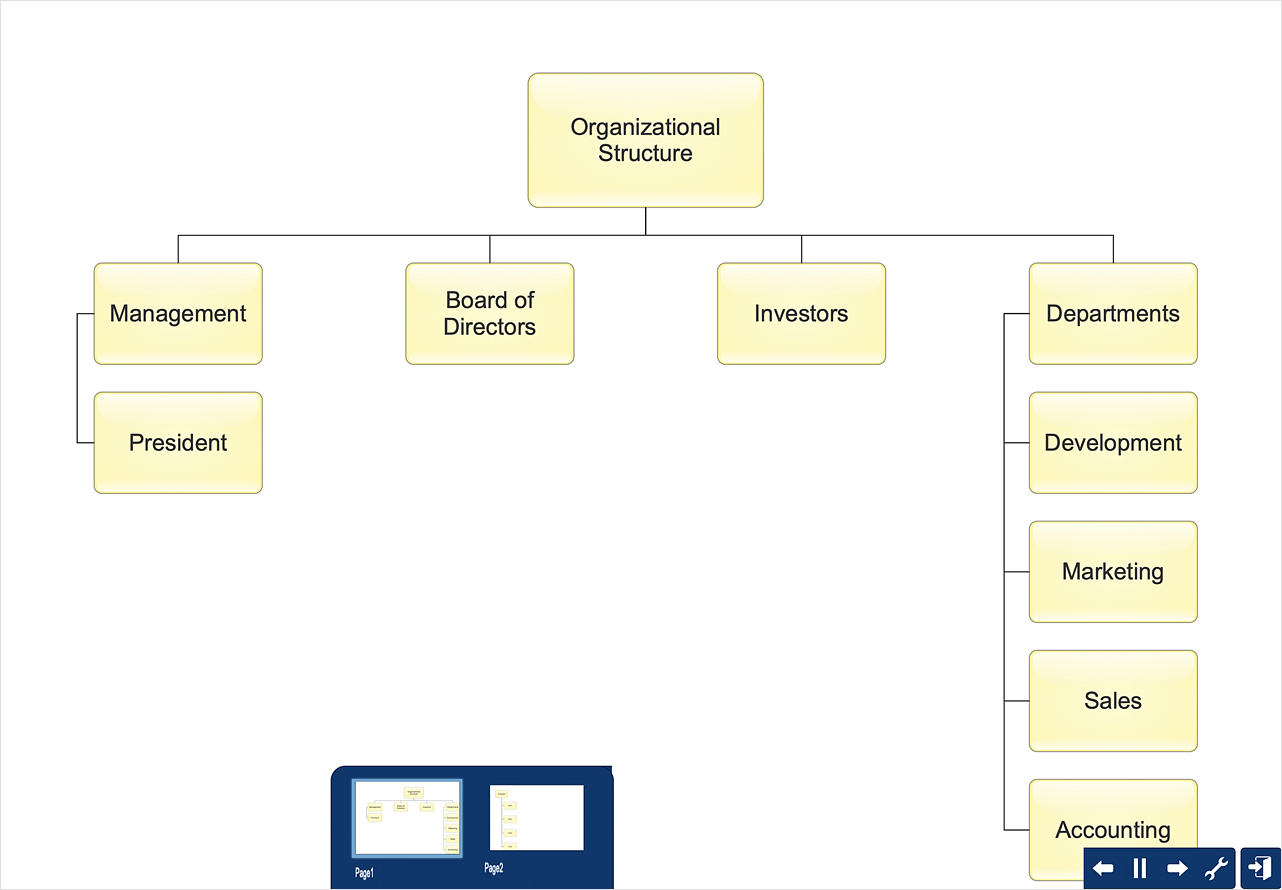
Use ConceptDraw MINDMAP for generating structured data on organization structure and then ConceptDraw DIAGRAM for presenting the results as chart.Matrix Organization Structure
Matrix organizational structure is one of the main forms of structures which is actively used by organizations to carry forth the functions of a company visually and effectively. Now we have ConceptDraw DIAGRAM diagramming and vector drawing software extended with 25 Typical Orgcharts solution from the Management area of ConceptDraw Solution Park which will help easy represent matrix organizational structure of any degree of complexity.Solar System
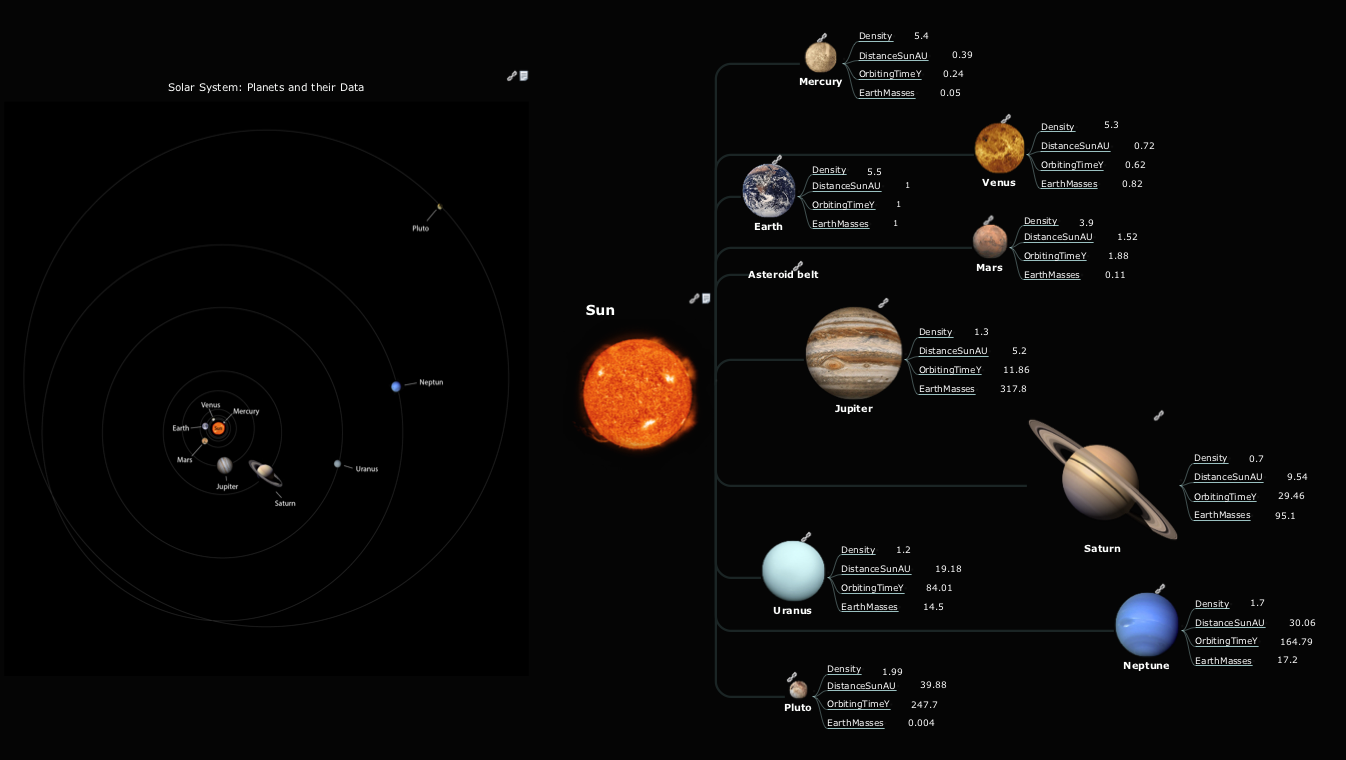
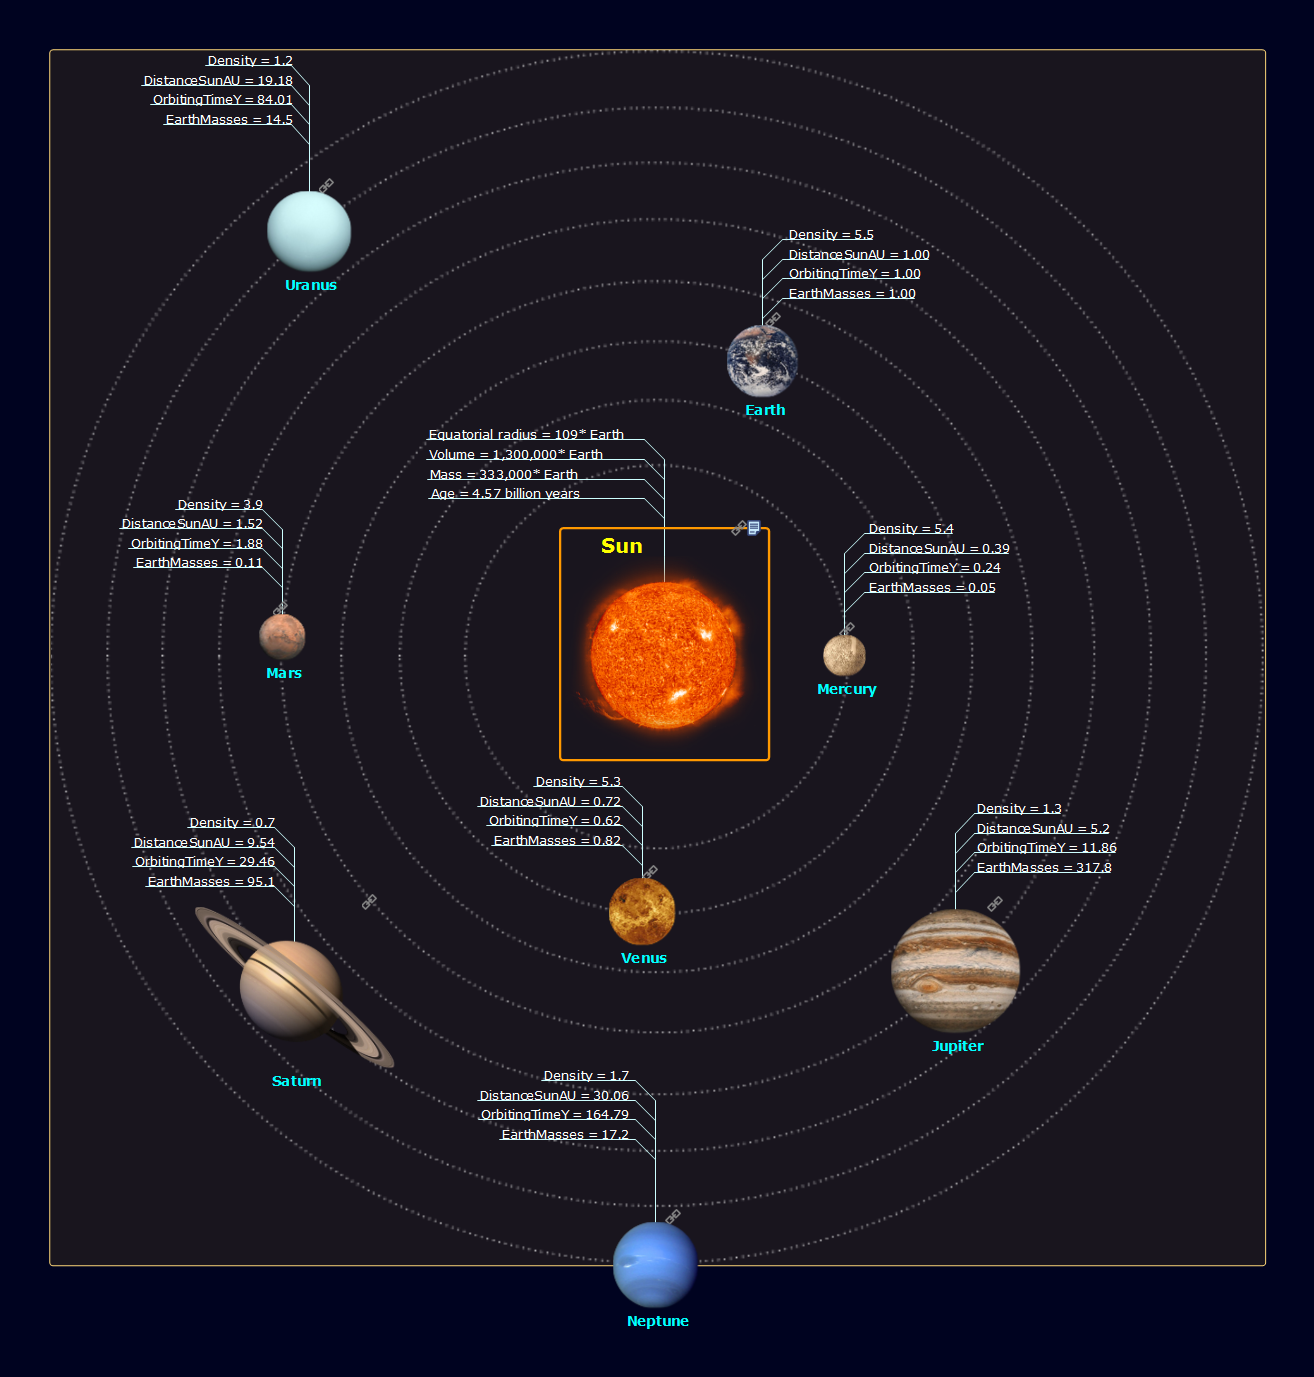
The Solar System is a system of planets, in the center of which is situated a bright star, a source of energy, heat and light - the Sun. The Solar System includes 9 planets and more than 63 their satellites, several dozen of comets and large number of asteroids. In the center of Solar System is situated the Sun, around which in orbits revolve the planets. The Sun is a giant ball of fire of very high temperature, consisting of plasma (ionized gas), composed from hydrogen and helium. There are two large groups of planets: terrestrial planets - Mercury, Venus, Earth and Mars, they are small in size with a rocky surface and are situated nearer to the Sun; planets giants - Jupiter, Saturn, Uranus and Neptune, large planets composed mostly of gas and characterized by the presence of rings, consisting of ice, dust and many rocky pieces. The planet Pluto doesn't fall into any of these groups, because despite its presence in the Solar System, it is situated too far away from the Sun and has a very small diameter. Mind Map created in ConceptDraw MINDMAP software is a visual presentation of Solar System's structure. You can also design detailed Mind Maps representing the main characteristics of each planet.Pyramid Diagram
Pyramid diagram is a chart used to visualize the data in a hierarchical (pyramid-like) structure and depict the foundation-based relationships. Pyramid diagram looks like a triangle divided by lines into several sections (layers) and can be oriented up or down, and represented in 2D or 3D view. 2D Pyramid diagrams are a great way to illustrate the hierarchical structure, 3D Pyramids are equally good to represent the class stratification and hierarchy. ConceptDraw DIAGRAM diagramming and vector drawing software with included Pyramid Diagrams solution from Marketing area of ConceptDraw Solution Park is a powerful application which contains templates and library of vector design elements for instantly drawing three level Pyramid model, four level and five level Triangle charts. All predesigned objects are easy for changing color style and resizing according to your needs, and ConceptDraw documents with Pyramid diagrams can be easy exported in various formats for further using in marketing presentations, for effective analyzing hierarchy levels and illustration your data and ideas.How to Create Flowcharts for an Accounting Information System
Accounting information is a system of interrelated processes which represent financial and accounting data, required for decision making. For representing the accounting processes in a visual and easy for perception form are constructed Accounting Flowcharts. For their creation are used special flowchart symbols, this makes Accounting flowcharts understandable for all users of accounting information system and helps them easy understand the sequence of steps involved to accounting processes. But how to create Flowcharts for an Accounting Information System fast and easy? Use of special design software is useful for this. ConceptDraw DIAGRAM software extended with Accounting Flowcharts solution is the best for creation accurate Accounting Flowcharts, for documentation and visually communication on how accounting processes work, how each operation is done. Accounting Flowcharts solution is supplied with library of predesigned commonly used vector symbols, Accounting Flowchart templates and samples demonstrating receiving, purchasing, payment, and other accounting processes.Organizational Structure Total Quality Management
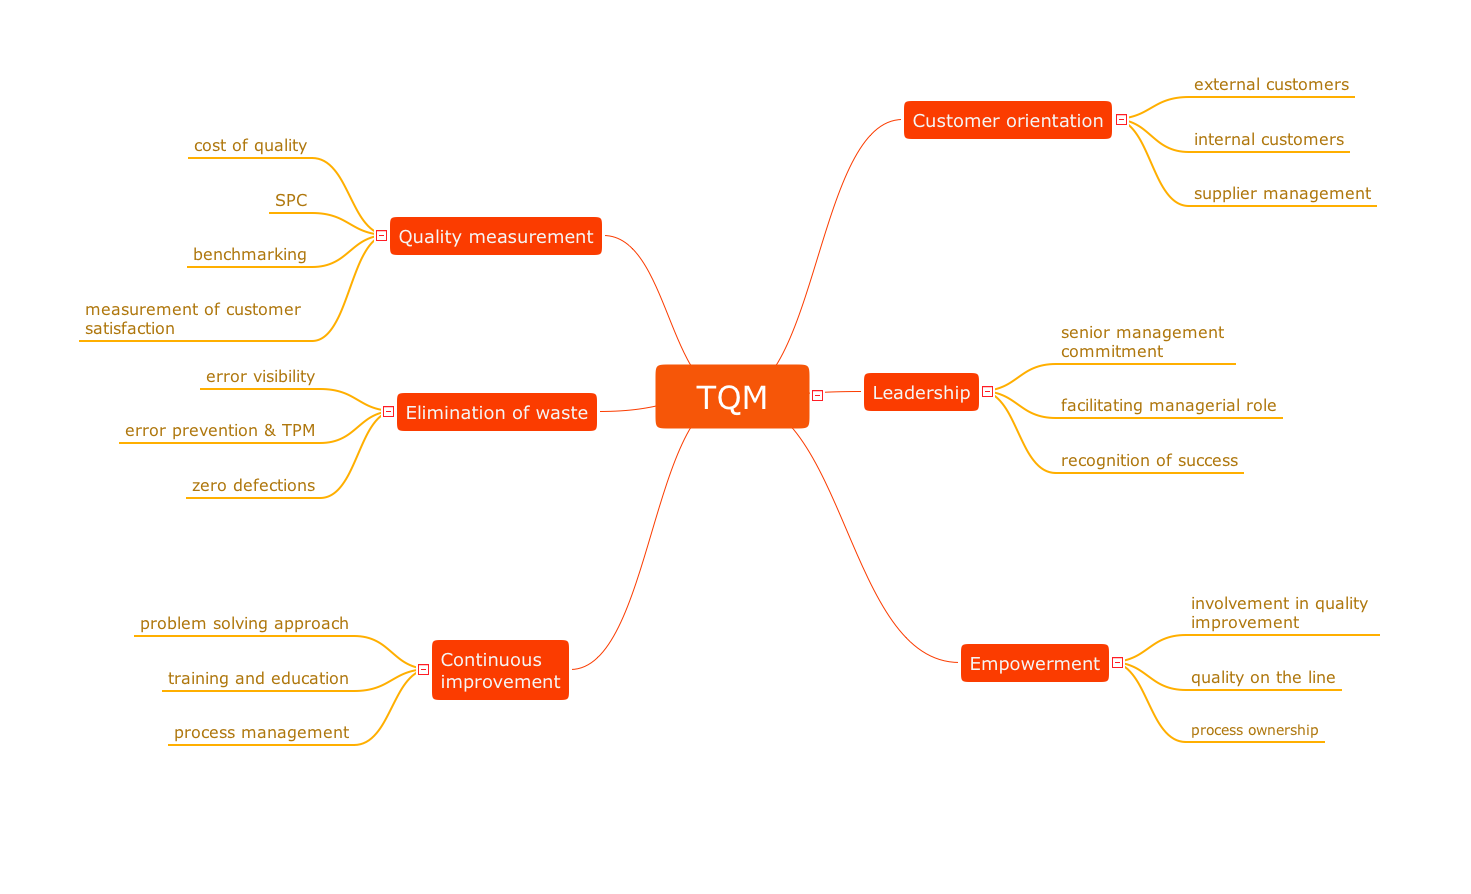
The Total Quality Management Diagram solution helps you and your organization visualize business and industrial processes. Create Total Quality Management diagrams for business process with ConceptDraw software.Remote Projects in Corporate Strategy
Communication is the main challenge and the key success factor for organizational project management in company with remote projects. Communicating visually via Skype you bring all projects together to achieve corporate goals.
- Mind Map Organizational Chart
- Mind Mapping For Information System
- Mind Map In A Organization
- Conceptdraw.com: Mind Map Software, Drawing Tools | Project ...
- Mind Map Accounting Information System
- Mind Map Of Solar System
- Model Based Systems Engineering | ConceptDraw MINDMAP ...
- Steps in the Accounting Process | How To Do A Mind Map In ...
- Structure Chart Example Of E Learning System


