HelpDesk
How to Make a Mind Map from a Project Gantt Chart
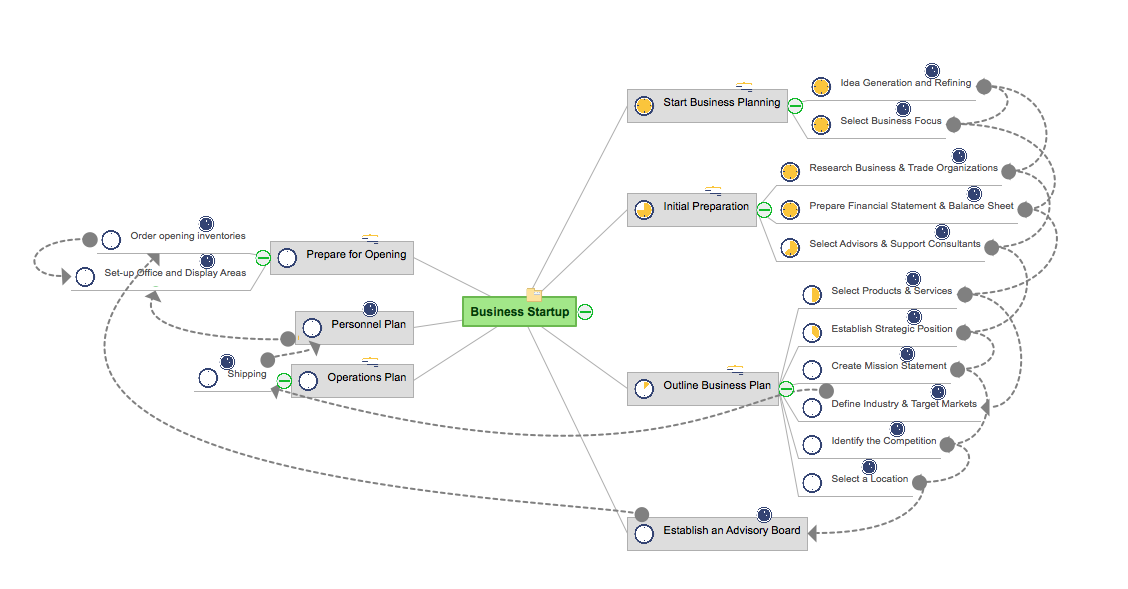
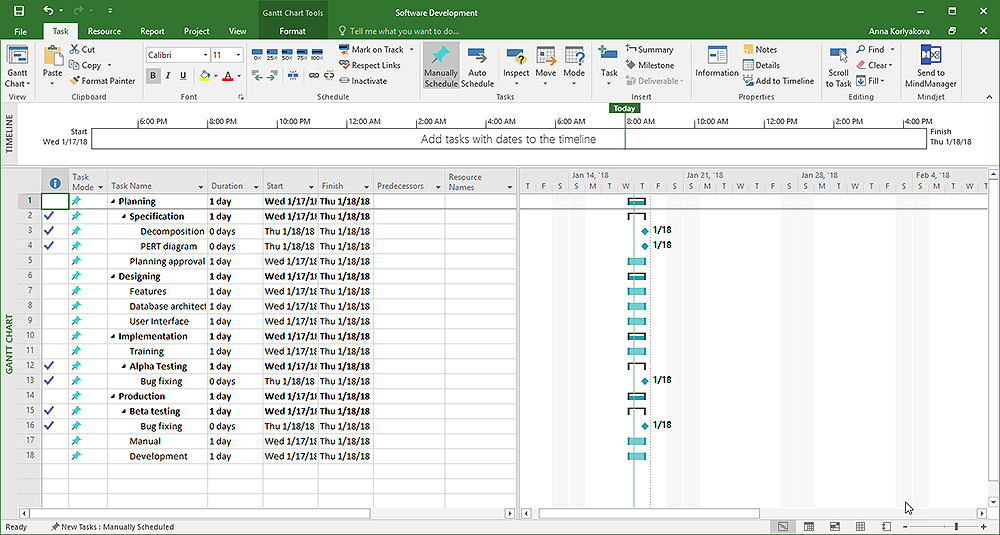
ConceptDraw Office allows you to see the project data from ConceptDraw PROJECT in a mind map structure by opening your project in ConceptDraw MINDMAP.HelpDesk
How to Improve a Project by Using a Mind Map
The InGyre technology provided in ConceptDraw Office makes it easy to copy one or more task branches from ConceptDraw MINDMAP to ConceptDraw PROJECT.
 Timeline Diagrams
Timeline Diagrams solution extends ConceptDraw PRO diagramming software with samples, templates and libraries of specially developed smart vector design elements of timeline bars, time intervals, milestones, events, today marker, legend, and many other elements with custom properties, helpful for professional drawing clear and intuitive Timeline Diagrams. Use it to design simple Timeline Diagrams and designate only the main project stages, or highly detailed Timeline Diagrams depicting all project tasks, subtasks, milestones, deadlines, responsible persons and other description information, ideal for applying in presentations, reports, education materials, and other documentation.
Project — Working With Costs
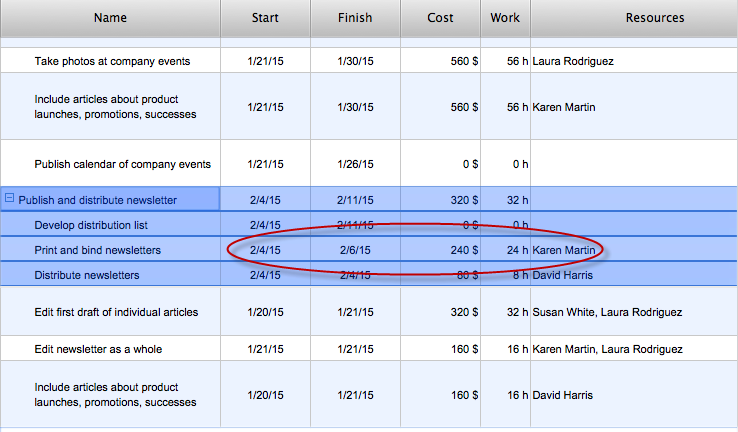
ConceptDraw PROJECT delivers a rich set of built-in functionalities and optional product extensions that support your daily workflow in time-saving and creative ways. This video lesson will teach you how to work with costs in your project document.HelpDesk
How To Create Risk Diagram (PDPC)
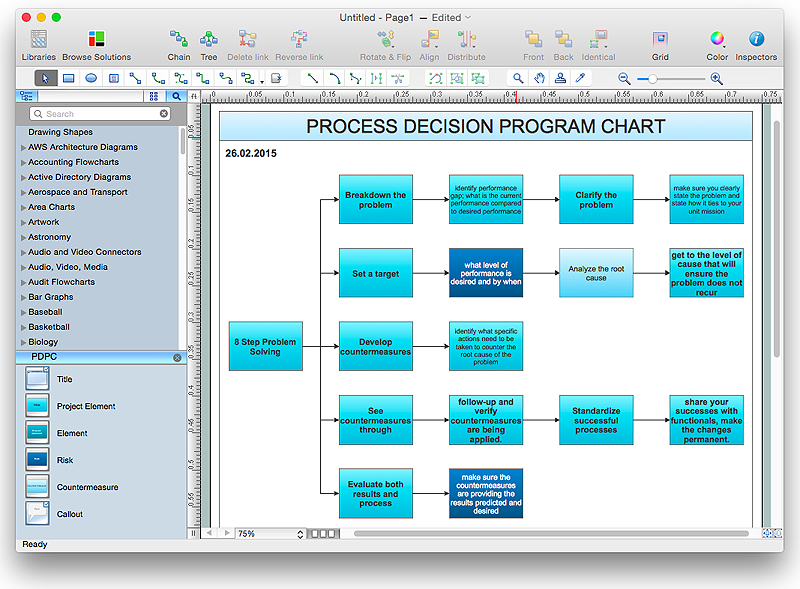
Article on how to identify possible risks when carrying out corrective actions, and define preventive actions
HelpDesk
How to Plan Projects Effectively Using Mind Maps and PM Easy Solution
The advanced data exchange capabilities of ConceptDraw MINDMAP and ConceptDraw PROJECT allows you to view your mind map as a Gantt chart. This way you are switching between views of the same file.Fishbone Diagram
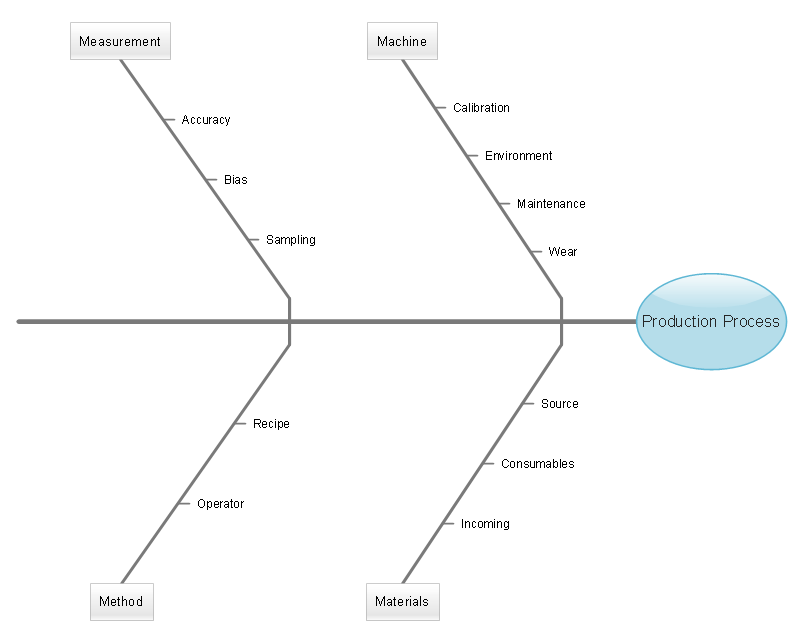
The use of specific types of visual diagrams is effective way to problems solving and decisions making. Fishbone diagram is a graphical tool used for visual and systematical analyzing the relationships between the solved problem and causes affecting its occurrence. It has hierarchical structure and that's why is well-suited for capturing in a mind map for a process of reviewing what branch is a real root cause of a given issue. ConceptDraw Office products and PM solutions offered by ConceptDraw STORE give the powerful help in questions of planning and project management. ConceptDraw PRO and ConceptDraw MINDMAP applications perfectly suit for designing professional-looking Fishbone Diagrams and allow effectively identify the root causes of quality issues using the Fishbone diagrams. The PM Response solution from the Project Management area of ConceptDraw Solution Park is powerful for improvement the response time to project changes, helps with iteration planning, with solving project challenges and discussing project layout approaches.Gantt Chart Diagram
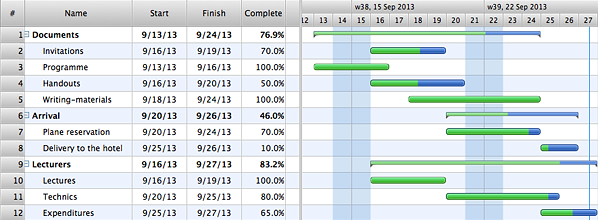
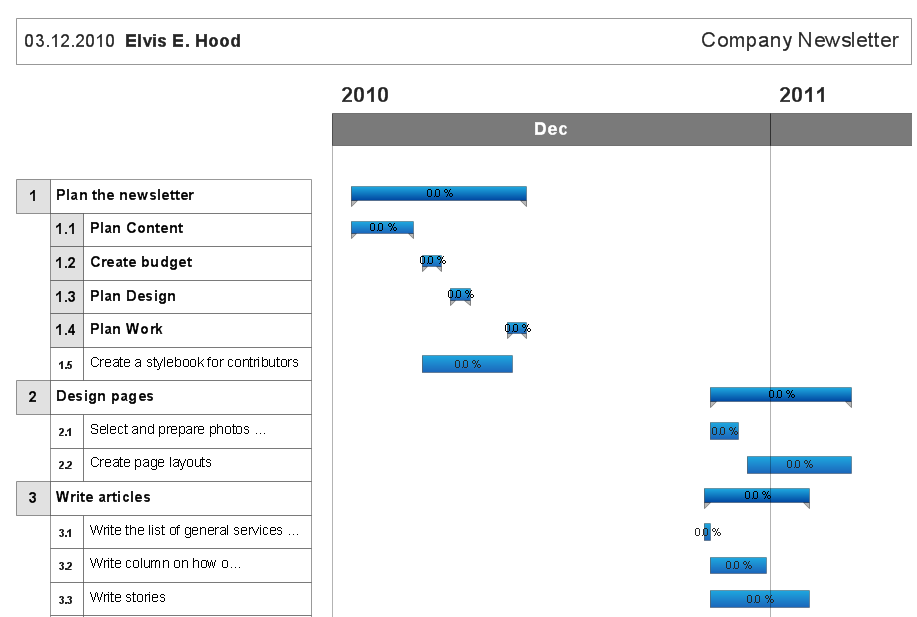
Gantt Chart is a popular type of bar charts and widely used projects planning method. It helps to illustrate the plan for some project, the progress of tasks, the resources planning, the schedule of works and working time. The Gantt Chart contains a set of intervals (bars) located on the time axis and reflects the use of resources by objects. Each bar represents a separate task in the project, its length is a duration of the work. The vertical axis of the graph represents the list of tasks. Besides, the chart can contain additional data, such as the percents of complete, the total tasks, the tasks dependencies, the key points (milestones), etc. The use of Gantt Chart greatly simplifies the project management and enables to visualize in visual and compressed view the most important information of the project, what resources are used for execution the certain tasks and which must to be the speed of their execution. ConceptDraw Office suite applications help to cope perfectly the project management tasks, to construct easily the basic structure of your project and create a Gantt Chart Diagram. PM Easy solution allows you to plan and execute the projects using the mind mapping technique, to implement planning using mind mapping, and track tasks using ConceptDraw Project.HelpDesk
How to Convert a Mind Map into MS Project XML
The easiest way to start this project is to conduct a brainstorm session that identifies necessary tasks, then prepare a project schedule in the form of a Gantt chart and assign resources to tasks. With ConceptDraw MINDMAP, you can initiate a project using mind map to represent all critical and important tasks. ConceptDraw MINDMAP supports a mind map export to MS Project; it also allows import a project file from MS Project giving team members who use OS X or Windows a working visual map of a planned project.- Gantt charts for planning and scheduling projects | Gant Chart in ...
- How to Create Presentation of Your Project Gantt Chart ...
- How to Make a Mind Map from a Project Gantt Chart | How to ...
- Conceptdraw.com: Mind Map Software, Drawing Tools | Project ...
- How to Convert a Mind Map into MS Project XML | How to Track ...
- How to Make a Mind Map from a Project Gantt Chart | Basic ...
- How to Make a Mind Map from a Project Gantt Chart | How to Create ...
- Project planning process - Flowchart | How to Make a Mind Map ...
- Project Timeline Chart
- Mindmap Project Management Pm Response Fishbone Diagram
