HelpDesk
How to Connect Text Data to a Time Series Chart on Your Live Dashboard
Time Series Dashboard means an integration of some type of diagrams: Line Charts, Bar Charts, Column Charts, and Dot Plots on a single space. The ConceptDraw Time Series Dashboard solution can be used to create the interactive Time Series dashboard. The libraries of Time Series Charts solution contain the Live Objects, that can change their appearance depending on the external data. Each chart from the Time Series dashboard displays particular source data. You can include Time Series Charts in your business or technical dashboards to show and compare the items changing over time.
HelpDesk
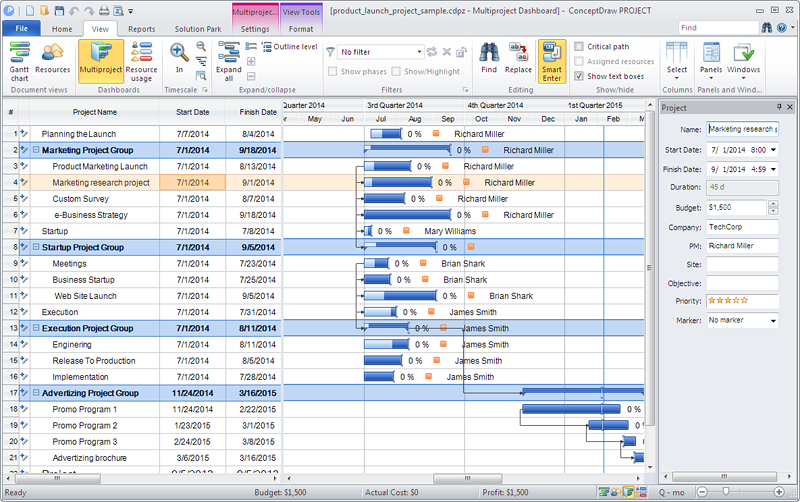
How to Manage Multiple Projects on Windows
ConceptDraw PROJECT lets you to track multiple projects at the same time."A Guide to the Project Management Body of Knowledge - Fifth Edition provides guidelines for managing individual projects and defines project management related concepts. It also describes the project management life cycle and its related processes, as well as the project life cycle.
The Guide recognizes 47 processes that fall into five basic process groups and ten knowledge areas that are typical of almost all projects.
The five process groups are:
Initiating,
Planning,
Executing,
Monitoring and Controlling,
Closing.
The ten knowledge areas are:
Project Integration Management,
Project Scope Management,
Project Time Management,
Project Cost Management,
Project Quality Management,
Project Human Resource Management,
Project Communications Management,
Project Risk Management,
Project Procurement Management,
Project Stakeholders Management (added in 5th edition).
Each of the ten knowledge areas contains the processes that need to be accomplished within its discipline in order to achieve an effective project management program. Each of these processes also falls into one of the five basic process groups, creating a matrix structure such that every process can be related to one knowledge area and one process group." [A Guide to the Project Management Body of Knowledge. Wikipedia]
The flow chart example "Project management life cycle" was created using the ConceptDraw PRO diagramming and vector drawing software extended with the Flowcharts solution from the area "What is a Diagram" of ConceptDraw Solution Park.
- Explain The Project Monitoring Flow Chart
- Monitoring System Flow Chart Diagram
- Flowchart | Circular arrows diagram - BPM life cycle | Enterprise ...
- Health Monitoring Information System Flowcharts
- Sample Of Flowchart About Monitoring System
- Process Flowchart | Project management life cycle - Flowchart ...
- Project Monitoring Tools Network Flow Diagram
- Flowchart Definition | Flow Map | Physical Security Plan | Hvac ...
- Er Diagram For Project Monitoring System
- Active Directory - Vector stencils library | Create Flow Chart on Mac ...
- Diamgram For Computer Monitor
- Types of Flowchart - Overview | Process Flowchart | Project ...
- Sample Project Flowchart . Flowchart Examples | Flowchart ...
- Sales Monitoring System
- Property Sales Process Flowchart
- Process Flowchart | Basic Audit Flowchart . Flowchart Examples | Dfd ...
- DFD Library System | Social Media Response DFD Flowcharts ...
- Process Flowchart | The Best Choice for Creating Diagram ...
- Create Flow Chart on Mac | Active Directory - Vector stencils library ...
- Flowchart Programming Project. Flowchart Examples | Sample ...


