HelpDesk
How to Track Your Project Plan vs. the Actual Project Condition
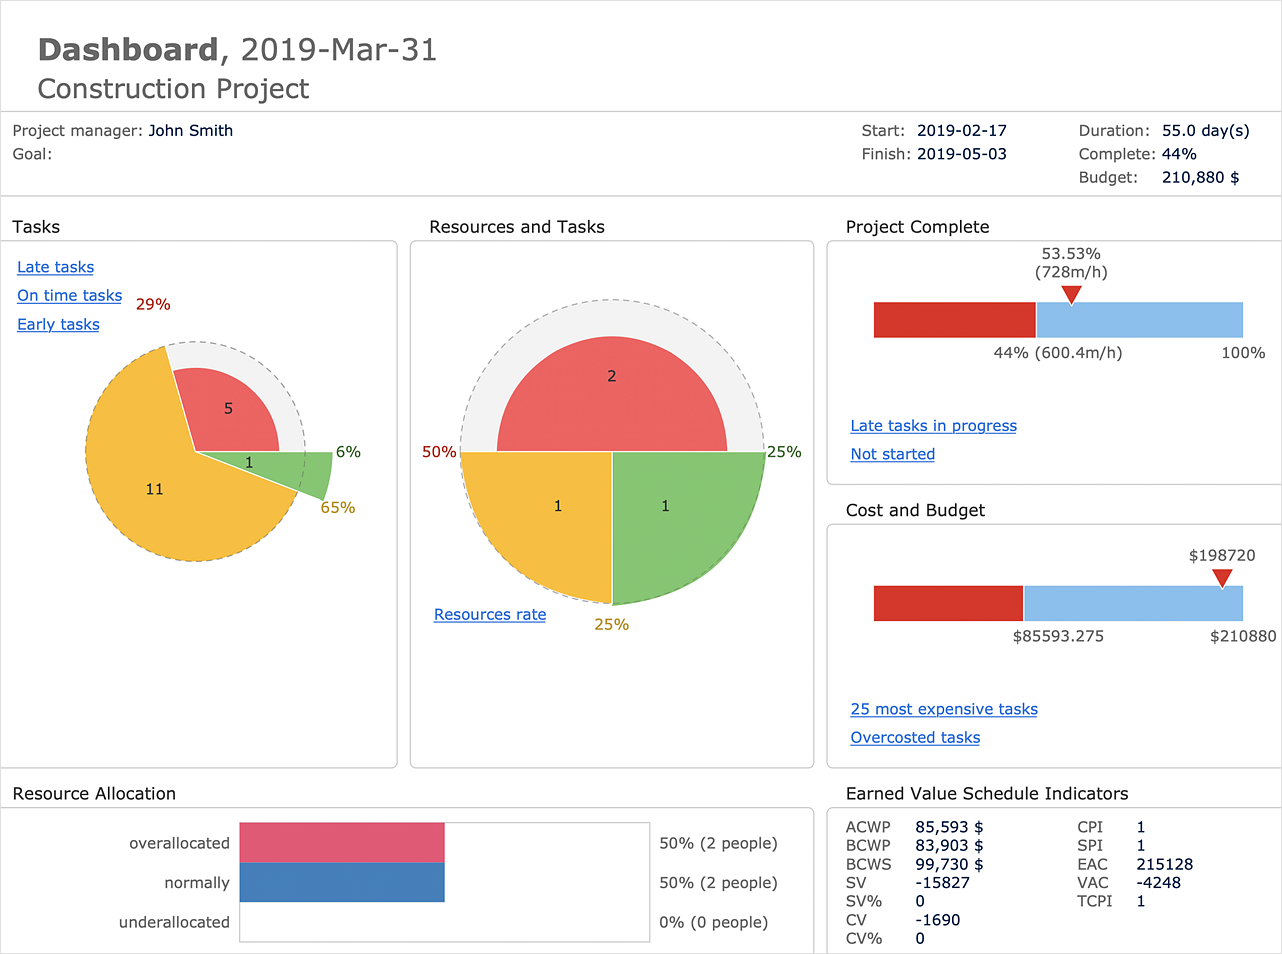
ConceptDraw PROJECT provides a user with the possibility to track how the project is going. Project Manager can compare the actual data with the planned and assess possible measures to resolve issues. ConceptDraw PROJECT has several types of visual reports that can help to assess visually the difference between planned and actual project data.
 Sales Dashboard
Sales Dashboard solution extends ConceptDraw DIAGRAM software with templates, samples and library of vector stencils for drawing the visual dashboards of sale metrics and key performance indicators (KPI).
KPI Dashboard
ConceptDraw DIAGRAM diagramming and vector drawing software supplied with Sales Dashboard solution from the Marketing area of ConceptDraw Solution Park provides the full set of useful tools which make it the best for producing the live KPI Dashboard of any complexity.
 Target and Circular Diagrams
This solution extends ConceptDraw DIAGRAM software with samples, templates and library of design elements for drawing the Target and Circular Diagrams.
Business Diagram Software
When managing the projects, people, or networks, there are daily designed and used different types of Business diagrams, so the powerful drawing software will be very useful for this. ConceptDraw DIAGRAM with large quantity of business solutions will meet your needs and will help you convey your ideas successful and rapidly, no matter are you professional or beginner. It is the best choice for business specialists and technical professionals who need quickly and easily explore, visualize, and communicate information. ConceptDraw DIAGRAM business diagram software is the most powerful business software and relational charting software. Create advanced, completely customizable Business Process Diagrams, Business Flow Charts, Work Flow Diagrams, Organizational Charts, Audit diagrams, Marketing diagrams, Value Stream Maps, TQM diagrams, ERD diagrams, EPC diagrams, Cause and Effect diagrams, Infographics, Dashboards, and other Relational business diagrams from your data using the powerful drawing tools of ConceptDraw Solution Park.
Performance Indicators
ConceptDraw DIAGRAM diagramming and vector drawing software offers the useful tools of the Sales Dashboard solution from the Marketing area for easy creating professional looking live dashboards which allow to track the business sales activity and progress thanks to representing the Key Performance Indicators (KPIs) on them.
 Calendars
Calendars solution extends ConceptDraw DIAGRAM software with templates, samples and library of vector stencils for drawing the business calendars and schedules.
Purchasing Flow Chart. Purchasing Flowchart Example
This sample shows the Purchasing Flow Chart Diagram that displays the money flow in the carbon offset sphere. The carbon offsets are the compensatory measures that the companies make for the carbon emissions. You can see on this sample the groups that have interests in the carbon offsets and the money flow after the carbon offset vendors sold the carbon offsets.Business Calendar
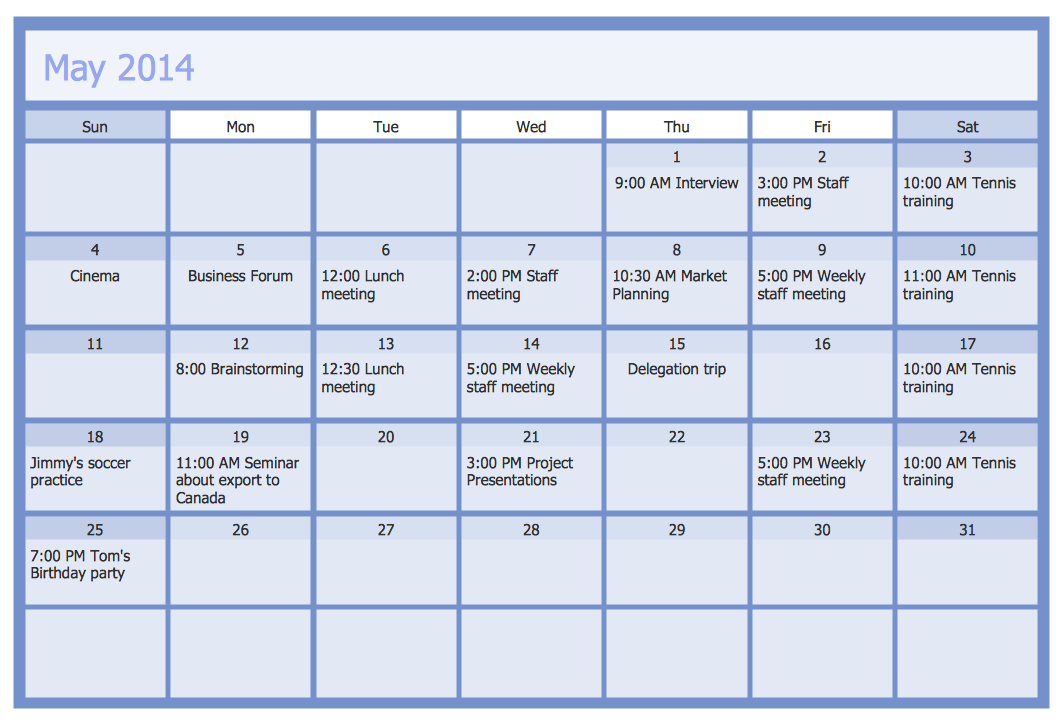
Business calendar is a special type of calendar, it must be functional, convenient for scheduling the affairs and meetings, and also must have strict, official and unobtrusive interface. So you must pay special attention to the business calendar design. Now you don't need to be an artist to design business calendar thanks to the unique drawing tools of Calendars Solution for ConceptDraw DIAGRAM diagramming and vector drawing software.
 Presentation Clipart
Presentation design elements solution extends ConceptDraw DIAGRAM software with slide samples, templates and vector stencils libraries with design elements of presentation symbols, arrows, callouts, backgrounds, borders and frames, title blocks.
 Data Flow Diagrams (DFD)
Data Flow Diagrams solution extends ConceptDraw DIAGRAM software with templates, samples and libraries of vector stencils for drawing the data flow diagrams (DFD).
HelpDesk
How to Save a Diagram as a Web Page
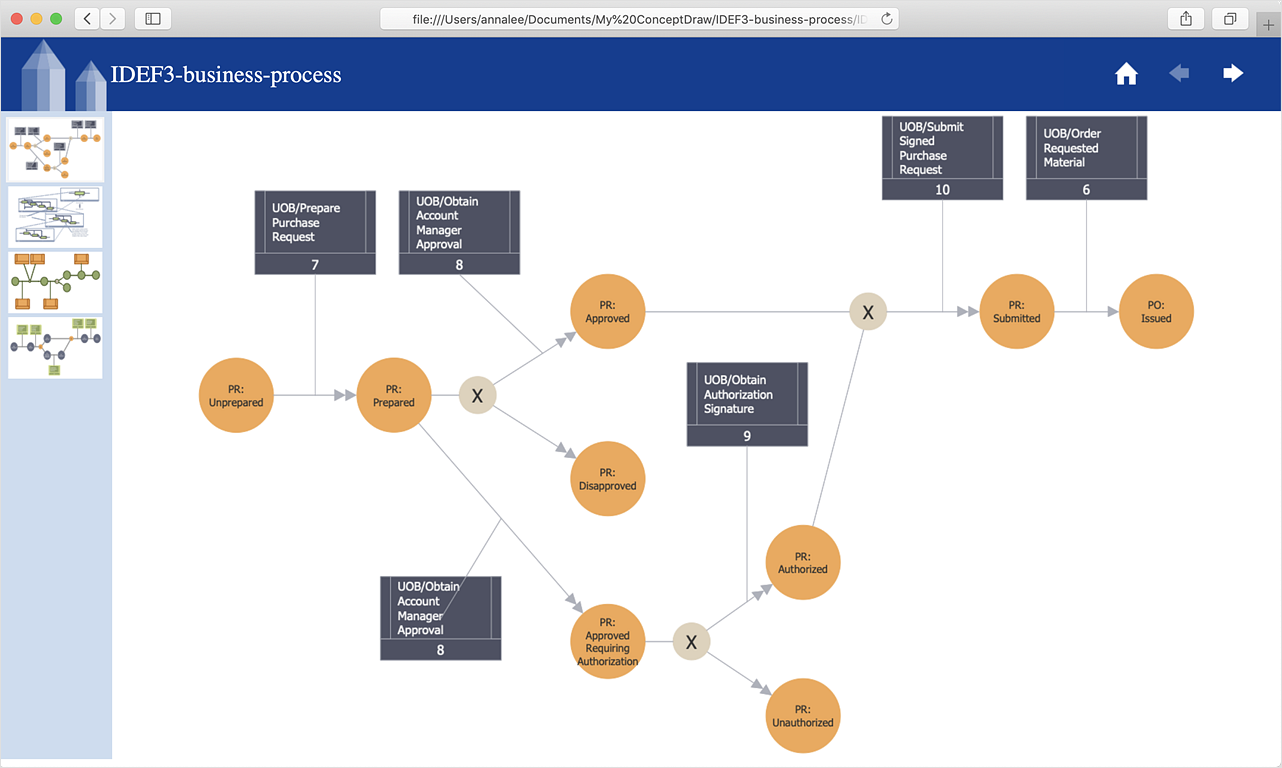
Using ConceptDraw DIAGRAM , you can save diagrams as a Web pages. ConceptDraw DIAGRAM adds the HTML tags that are needed to display your diagrams in a Web browser, so all you have to do is design their appearance.- Monthly Sales Dashboard
- Dashboard Project Management Kpi
- How to Draw a Line Chart Quickly | Sales Dashboard | Pie Donut ...
- Target and Circular Diagrams | Blank Calendar Template | Project ...
- Target and Circular Diagrams | Calendars | Monthly Dashboard ...
- Weekly Dashboard Template
- PM Planning | Pyramid Diagram | PM Teams | Chart Monthly Project
- Monthly Hr Reports Templates
- Project Management Calendar Template
- Project task status dashboard - Template | Program Evaluation and ...
- Monthly Calendar Template
- Sales Dashboard Examples | KPI Dashboard | Sales Dashboard ...
- Revenue Dashboard Examples
- Sales Dashboard | Meter Dashboard | PM Dashboards | Dashboard
- Sales Dashboard Template | KPI Dashboard | Data Visualization ...
- Chart And Graph Examples On Sales
- Blank Calendar Template | Economic Calendar | Calendars | 2016 ...
- Manage Projects Template
- Monthly Calendar Pages
- Monthly Report Ppt Template


