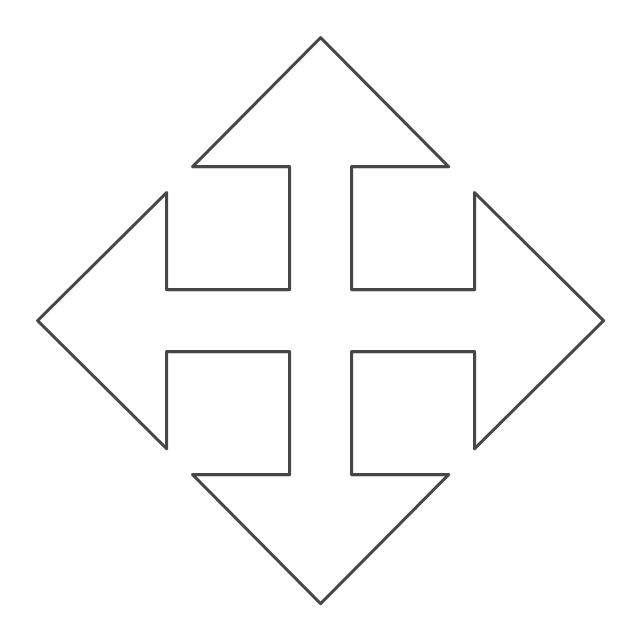
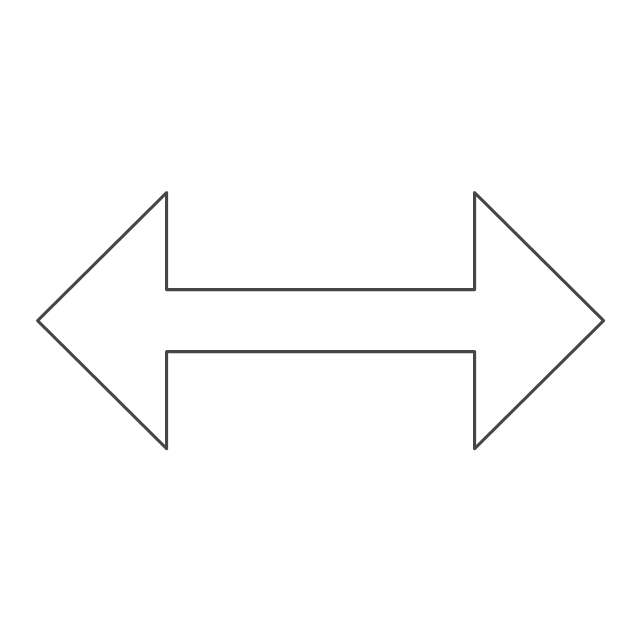
The vector stencils library "Interactions" contains 18 interaction elements icons: mouse pointers, splitters, select frame.
Use it to design graphic user interface (GUI) prototypes of your software applications for Windows 8.
"In computing, a pointer or mouse cursor (as part of a personal computer WIMP style of interaction) is a graphical image on the computer monitor or other display device. The pointer echoes movements of the pointing device, commonly a mouse or touchpad, and signals the point where actions of the user take place. It can be used to select and move other graphical user interface elements, and is distinct from the cursor, which responds to keyboard input. The cursor may also be repositioned using the pointer.
The pointer commonly appears as an angled arrow, (angled because historically that improved appearance on low resolution screens) but it can vary within different programs or operating systems. The use of a pointer is employed when the input method, or pointing device, is a device that can move fluidly across a screen and select or highlight objects on the screen." [Pointer (graphical user interfaces). Wikipedia]
The design elements example "Interactions - Vector stencils library" was created using the ConceptDraw PRO diagramming and vector drawing software extended with the Windows 8 User Interface solution from the Software Development area of ConceptDraw Solution Park.
How to Create a Scatter Chart
Simple tutorial help you learn how to draw a scatter chart and increase you possibilities of understanding and work more effective with our scatter chart software.How to Create a Line Chart
Create a Line Chart with ConceptDraw using our tips. Here you can find an explanation of how to create a line chart quickly.How to Create a Pyramid Diagram
ConceptDraw Pyramid Diagram software allows drawing column charts using predesigned objects or drawing tools. In ConceptDraw Pyramid Diagram software you can find a complete set of column chart tools and objects.How to Create a Pie Chart
Create a Pie Chart with ConceptDraw software quickly and easily. The simple tutorial helps you learn how to create a pie chart.How to Create a Bar Chart
The answer how to create a bar chart can be found in ConceptDraw software. The simple tips guide you through the software to quickly learn how to create a bar chart.Business Process Workflow Diagram
Business Process Workflow Diagram is a professional visual tool that is widely applied for business development, business analysis, business process optimization and documenting business processes. Business Process Workflow Diagram lets depict in details the steps of business processes and flow of tasks between them, the execution of business processes, transfer of data and documents. The workflows on the Business Process Workflow Diagram are represented using the set of common symbols which let easy illustrate business processes and process flows, depict the start, all major steps and end of the process, what data are used by the process, how the data flow through the business areas within scope of our project, how the tasks are executed and by who, and how workers interact with each other.
Flow chart Example. Warehouse Flowchart
Warehouse Flowcharts are various diagrams that describe the warehousing and inventory management processes on the warehouses. Typical purposes of Warehouse Flowcharts are evaluating warehouse performance, measuring efficiency of customer service and organizational performance. This type of Workflow diagrams can be used for identifying any disconnection between business activities and business objectives. They are effectively used by warehouse-related people and organizations, manufacturers, wholesalers, exporters, importers, transporters, and others. Standard Warehousing process flow diagram and standard Workflow diagram are used for process identification for further evaluating effectiveness and profitability of overall business process. Use the ConceptDraw PRO vector graphic software extended with Flowcharts solution to design your own professional-looking Workflow diagrams and Flowcharts of any types, including the Warehouse flowchart, Process flow diagrams which depict in details all steps of Warehouse packages flow. Microsoft Visio, designed for Windows users, can’t be opened directly on Mac. But fortunately, there are several Visio alternatives for Mac which will help Mac users to work Visio files. With ConceptDraw PRO, you may open, edit and save files in Visio format.
Concept Maps
As concept map consists from conception-blocks and links between them, you can use ConceptDraw library objects and add to a document as much objects as you need. ConceptDraw tools let you to edit, group, move objects, change their appearance and add text signs and raster or vector pictures. ConceptDraw PRO diagramming and vector drawing software extended with Concept Maps Solution from the "Diagrams" Area is effective tool for creating professional looking Concept Maps.UML Flowchart Symbols
The UML diagram is a powerful tool which lets visually represent all system's components, the interactions between them and relationships with external user interface. The Rapid UML solution for ConceptDraw PRO software offers diversity of UML flowchart symbols for drawing all types of UML diagrams.- Mouse Icon Expand Column
- Mouse Resize Pointer
- Interactions - Vector stencils library | Unavailable Image Icon
- Link Select Mouse Pointer
- Windows 10 User Interface | Functions Of Normal Select Pointer
- Window elements - Vector stencils library | Network Icon | Network ...
- Interactions - Vector stencils library | MS Windows Vista user ...
- A Circle Waiting Cursor
- Interactions - Vector stencils library | Interactions - Vector stencils ...
