TQM Diagram Tool

Process Flowchart


Business diagrams & Org Charts with ConceptDraw PRO


 Management
This solution extends ConceptDraw PRO v9 and ConceptDraw MINDMAP v7 with Management Diagrams and Mind Maps (decision making, scheduling, thinking ideas, problem solving, business planning, company organizing, SWOT analysis, preparing and holding meetings
The vector stencils library "TQM diagrams" contains 58 TQM symbols. Use it in business process re-engineering, total quality management, continuous improvement, and quality solutions to draw cause-and-effect diagrams, top-down, and cross-functional process flow charts in the ConceptDraw PRO diagramming and vector drawing software extended with the Total Quality Management (TQM) Diagrams solution from the Quality area of ConceptDraw Solution Park.
Transportation

Inbound Goods
Storage
Procedure

Operation

Operation/ Inspection
Issue

Organization Function
2-Part Function

Decision 1 (TQM)
-tqm-diagrams---vector-stencils-library.png--diagram-flowchart-example.png)
Decision 2 (TQM)
-tqm-diagrams---vector-stencils-library.png--diagram-flowchart-example.png)
Multi in/out Decision (Multi-Input on right)
-tqm-diagrams---vector-stencils-library.png--diagram-flowchart-example.png)
Multi in/out Decision (Multi-Input on left)
-tqm-diagrams---vector-stencils-library.png--diagram-flowchart-example.png)
External Organization

External Process

Inspection/Measurement

Metric

2-part metric

System Database
System Support

System Function

Delay

Connector (TQM)
-tqm-diagrams---vector-stencils-library.png--diagram-flowchart-example.png)
Off-Page Reference

Connected Issues

Fabrication (black)
-tqm-diagrams---vector-stencils-library.png--diagram-flowchart-example.png)
Fabrication (white)
-tqm-diagrams---vector-stencils-library.png--diagram-flowchart-example.png)
Move (black)
-tqm-diagrams---vector-stencils-library.png--diagram-flowchart-example.png)
Move (white)
-tqm-diagrams---vector-stencils-library.png--diagram-flowchart-example.png)
Store (black)
-tqm-diagrams---vector-stencils-library.png--diagram-flowchart-example.png)
Store (white)
-tqm-diagrams---vector-stencils-library.png--diagram-flowchart-example.png)
Inspection (black)
-tqm-diagrams---vector-stencils-library.png--diagram-flowchart-example.png)
Inspection (white)
-tqm-diagrams---vector-stencils-library.png--diagram-flowchart-example.png)
Selectable Process (All White)
-tqm-diagrams---vector-stencils-library.png--diagram-flowchart-example.png)
Selectable Process ('Fabrication' Black)
-tqm-diagrams---vector-stencils-library.png--diagram-flowchart-example.png)
Selectable Process ('Move' Black)
-tqm-diagrams---vector-stencils-library.png--diagram-flowchart-example.png)
Selectable Process ('Store' Black)
-tqm-diagrams---vector-stencils-library.png--diagram-flowchart-example.png)
Selectable Process ('Inspection' Black)
-tqm-diagrams---vector-stencils-library.png--diagram-flowchart-example.png)
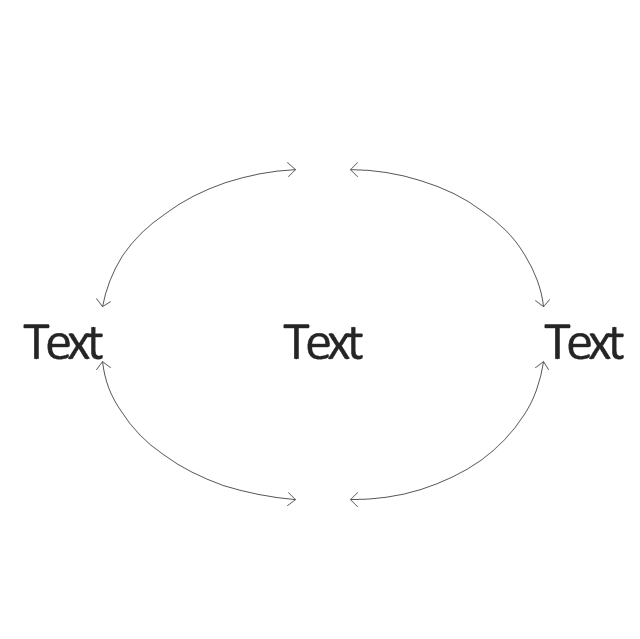
Work Flow Loop 1
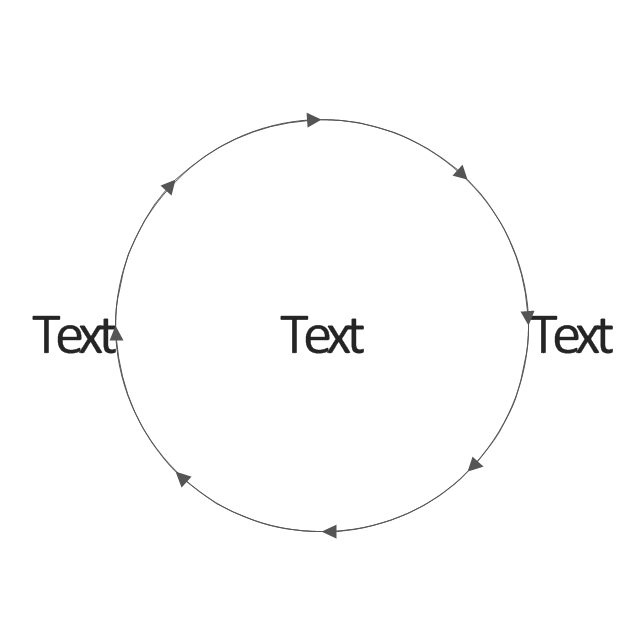
Work Flow Loop 2
Feedback Arrow
X-Function - Vertical

X-Function - Horizontal

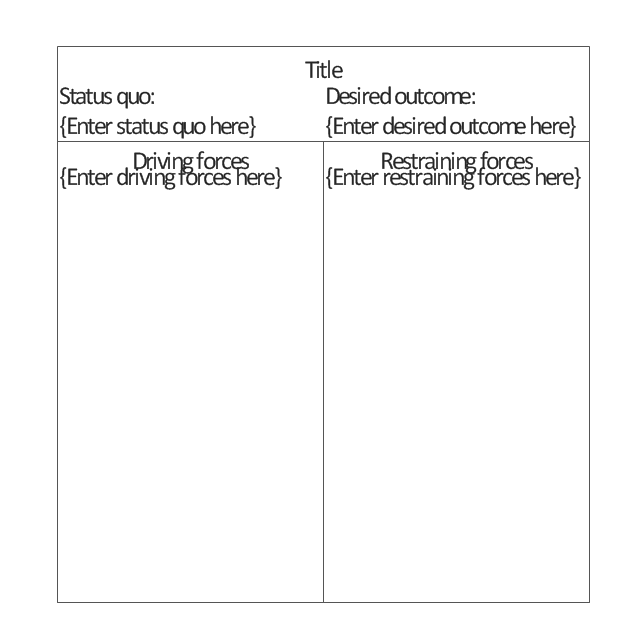
Force-Field Analysis
Cause 1
Cause 2
Cause 3
Category
Effect
Fish Frame

Dynamic Connector
Result
No Result

Branch: Return

Branch: No Return

Interrupt

External Control

Refinement

Venn Diagram Template for Word

Project — Working With Tasks

Examples of Flowcharts, Org Charts and More


HelpDesk
How to Add a Fishbone Diagram to PowerPoint Presentation

Venn Diagram Examples for Problem Solving. Environmental Social Science. Human Sustainability Confluence

The vector stencils library "TQM diagrams" contains 58 TQM symbols. Use it in business process re-engineering, total quality management, continuous improvement, and quality solutions to draw cause-and-effect diagrams, top-down, and cross-functional process flow charts in the ConceptDraw PRO diagramming and vector drawing software extended with the Total Quality Management (TQM) Diagrams solution from the Quality area of ConceptDraw Solution Park.
Transportation
Inbound Goods
Storage
Procedure
Operation
Operation/ Inspection
Issue
Organization Function
2-Part Function
Decision 1 (TQM)
Decision 2 (TQM)
Multi in/out Decision (Multi-Input on right)
Multi in/out Decision (Multi-Input on left)
External Organization
External Process
Inspection/Measurement
Metric
2-part metric
System Database
System Support
System Function
Delay
Connector (TQM)
Off-Page Reference
Connected Issues
Fabrication (black)
Fabrication (white)
Move (black)
Move (white)
Store (black)
Store (white)
Inspection (black)
Inspection (white)
Selectable Process (All White)
Selectable Process ('Fabrication' Black)
Selectable Process ('Move' Black)
Selectable Process ('Store' Black)
Selectable Process ('Inspection' Black)
Work Flow Loop 1
Work Flow Loop 2
Feedback Arrow
X-Function - Vertical
X-Function - Horizontal
Force-Field Analysis
Cause 1
Cause 2
Cause 3
Category
Effect
Fish Frame
Dynamic Connector
Result
No Result
Branch: Return
Branch: No Return
Interrupt
External Control
Refinement
Management Tools — Total Quality Management

Product Overview

In searching of alternative to MS Visio for MAC and PC with ConceptDraw PRO

- Multiple Cause Diagram
- ER Diagram Programs for Mac | Express-G Diagram | Multi Layer ...
- Best Multi -Platform Diagram Software | UML Diagram Types List ...
- Management Tools — Total Quality Management | Multi Layer Venn ...
- Multi Layer Venn Diagram . Venn Diagram Example | Venn ...
- Venn Diagram Template | Multi Layer Venn Diagram . Venn Diagram ...
- The Best Drawing Program for Mac | Best Multi -Platform Diagram ...
- Best Multi -Platform Diagram Software | Business Diagram Software ...
- SWOT and TOWS Matrix Diagrams | Multi Layer Venn Diagram ...
- Simple Drawing Applications for Mac | Matrix Organization Structure ...
- Multi Functional Tqm System
- Basic Diagramming | Mathematics | Best Multi -Platform Diagram ...
- Simple Drawing Applications for Mac | Venn Diagram Examples for ...
- ER Diagram Programs for Mac | Multi Layer Venn Diagram . Venn ...
- Multi Banking System Uml Diagrams
- Context Diagram Template | Software Diagram Templates | UML ...
- How to Manage Multiple Projects on Windows | How to View Tasks ...
- Best Multi -Platform Diagram Software | PM Planning | Bubble ...
- Basic Diagramming | Functional Block Diagram | Block Diagram ...
- Multi Page Cross Functional Visio Diagram