Multi Layer Venn Diagram. Venn Diagram Example
To visualize the relationships between subsets of the universal set you can use Venn diagrams. To construct one, you should divide the plane into a number of cells using n figures. Each figure in the chart represents a single set of, and n is the number of represented sets. Splitting is done in a way that there is one and only one cell for any set of these figures, the points of which belong to all the figures from the set and do not belong to others. The plane on which the figures are represented, is the universal set U. Thus, the point which does not belong to any of the figures, belongs only to U.Best Multi-Platform Diagram Software
ConceptDraw DIAGRAM is a powerful tool for drawing business communication ideas and concepts, simple visual presentation of numerical data in the Mac environment.HelpDesk
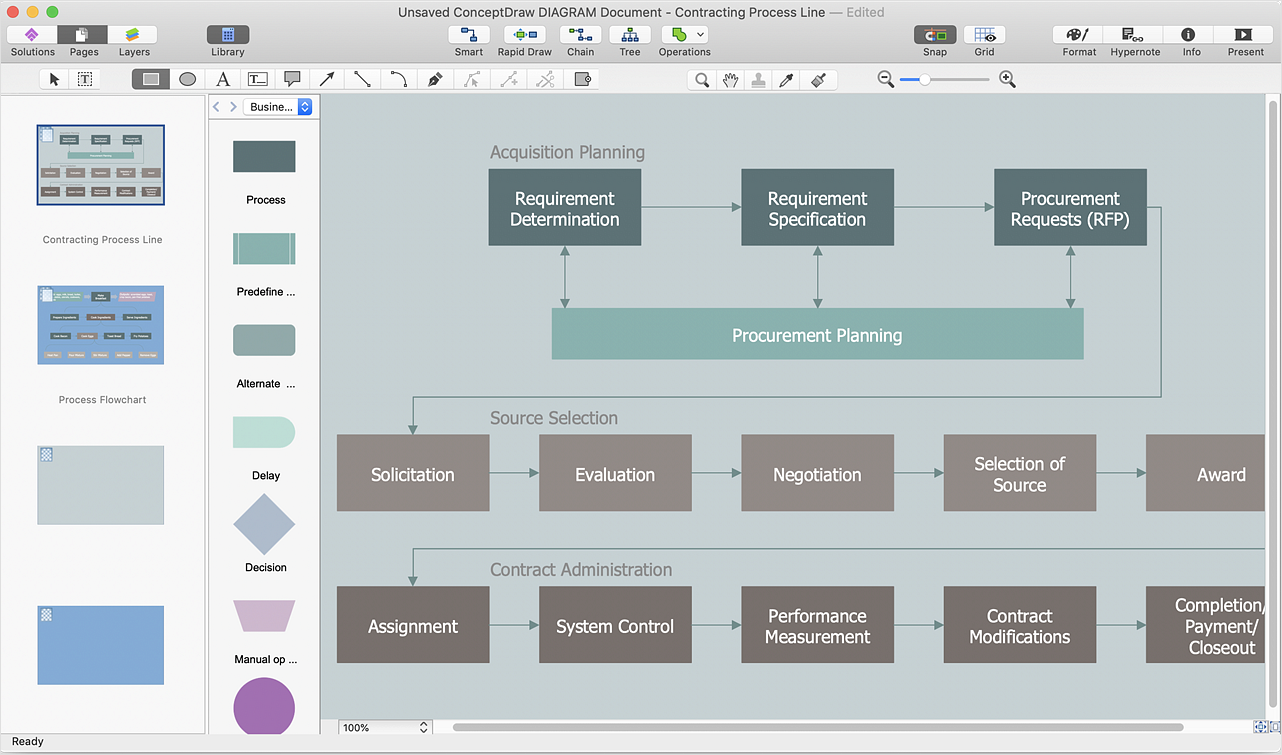
How to Create Multipage Diagram From a Single Page Template
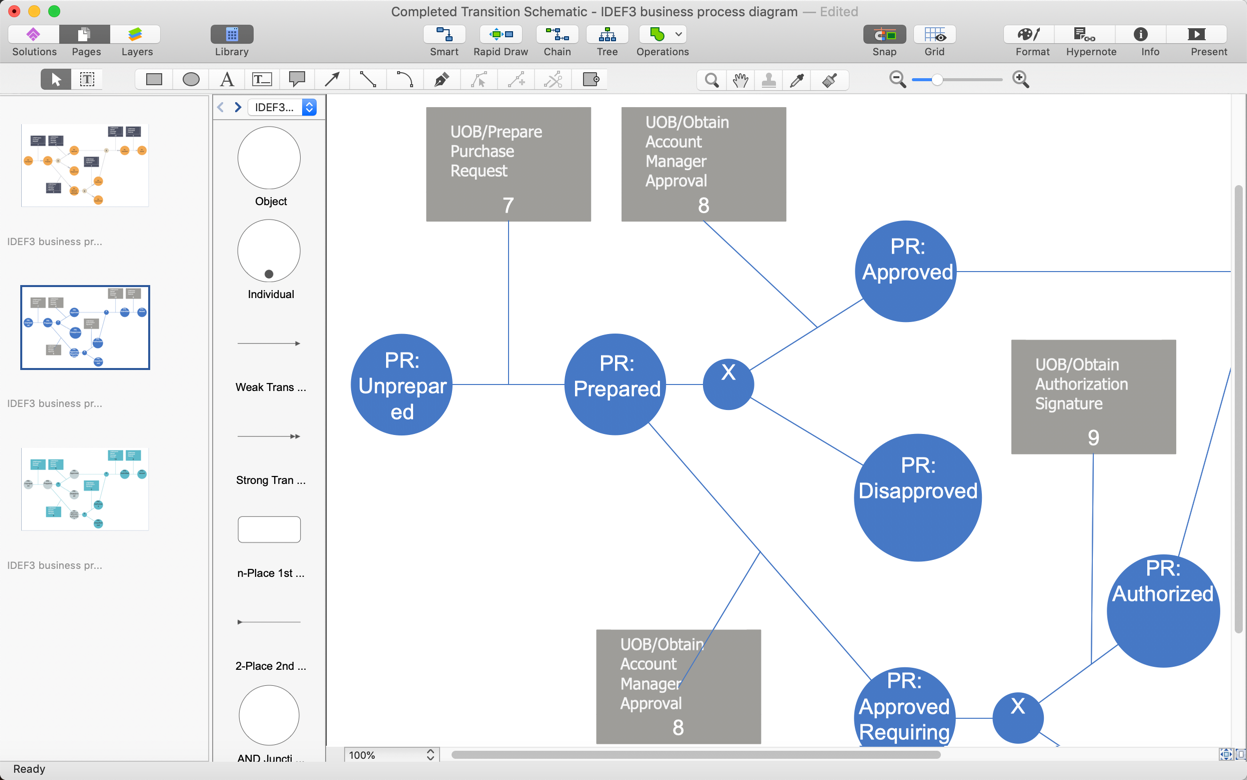
Most ConceptDraw DIAGRAM templates contain one page. But some templates can include several pages: for example, several single-page diagrams and a background page. You can customize any template for your needs by adding pages, rearranging them, or by setting a custom formatting.The vector stencils library "Data flow diagram (DFD)" contains 15 DFD elements.
Use it for process-oriented models, data-oriented models, data flowcharts, data process diagrams, structured analysis diagrams, and information flow diagrams in the ConceptDraw PRO diagramming and vector drawing software extended with the Data Flow Diagrams solution from the Software Development area of ConceptDraw Solution Park.
Use it for process-oriented models, data-oriented models, data flowcharts, data process diagrams, structured analysis diagrams, and information flow diagrams in the ConceptDraw PRO diagramming and vector drawing software extended with the Data Flow Diagrams solution from the Software Development area of ConceptDraw Solution Park.
Venn Diagram Examples for Problem Solving. Environmental Social Science. Human Sustainability Confluence
The Venn diagram example below shows sustainable development at the confluence of three constituent parts. Create your Venn diagrams for problem solving in environmental social science using the ConceptDraw DIAGRAM diagramming and vector drawing software extended with the Venn Diagrams solution from the area "Diagrams" of ConceptDraw Solution Park.
 Interactive Voice Response Diagrams
Interactive Voice Response Diagrams solution extends ConceptDraw DIAGRAM software with samples, templates and libraries of ready-to-use vector stencils that help create Interactive Voice Response (IVR) diagrams illustrating in details a work of interactive voice response system, the IVR system’s logical and physical structure, Voice-over-Internet Protocol (VoIP) diagrams, and Action VoIP diagrams with representing voice actions on them, to visualize how the computers interact with callers through voice recognition and dual-tone multi-frequency signaling (DTMF) keypad inputs.
HelpDesk
How to Make Different Backgrounds Within a Multipage Drawing
Tips on how to add different backgrounds within single ConceptDraw documentDesign Data Flow. DFD Library
Data flow diagram or DFD is a type of diagrams used for graphical representation the "flow" of data through an information system, for effective modeling its process aspects and for visualization the data processing. They are one of the best tools for clearly making an overview of the system that will be developed, for depiction in details what kinds of information will be inputted to the system and outputted from it, where they will be stored, and other details. ConceptDraw DIAGRAM software with Data Flow Diagrams solution from Software Development area of ConceptDraw Solution Park is powerful in a field of designing the DFDs. Three libraries containing 49 vector DFD shapes and symbols are offered by Data Flow Diagrams (DFD) solution. Use them to design data flow diagrams, information flow diagrams, data flowcharts, data process diagrams, structured analysis diagrams, to create the data-oriented models or process-oriented models, and so on. Pay also attention for the included collection of DFD samples, examples and built-in templates at ConceptDraw STORE.3 Circle Venn Diagram. Venn Diagram Example
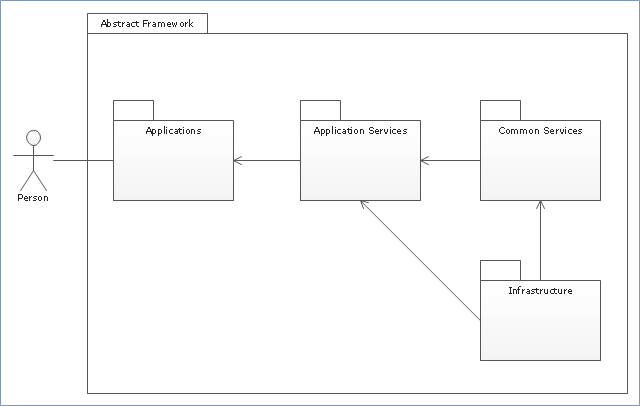
This template shows the Venn Diagram. It was created in ConceptDraw DIAGRAM diagramming and vector drawing software using the ready-to-use objects from the Venn Diagrams Solution from the "Diagrams" area of ConceptDraw Solution Park. Venn Diagrams visualize all possible logical intersections between several sets and are widely used in mathematics, logic, statistics, marketing, sociology, etc."Package diagram is UML structure diagram which shows packages and dependencies between the packages.
Model diagrams allow to show different views of a system, for example, as multi-layered (aka multi-tiered) application - multi-layered application model.
The following nodes and edges are typically drawn in a package diagram: package, packageable element, dependency, element import, package import, package merge." [uml-diagrams.org/ package-diagrams.html]
The template "UML package diagram" for the ConceptDraw PRO diagramming and vector drawing software is included in the Rapid UML solution from the Software Development area of ConceptDraw Solution Park.
www.conceptdraw.com/ solution-park/ software-uml
Best Program to Make Diagrams
Make diagrams, charts, workflows, flowcharts, org charts, project charts easily with ConceptDraw software.
HelpDesk
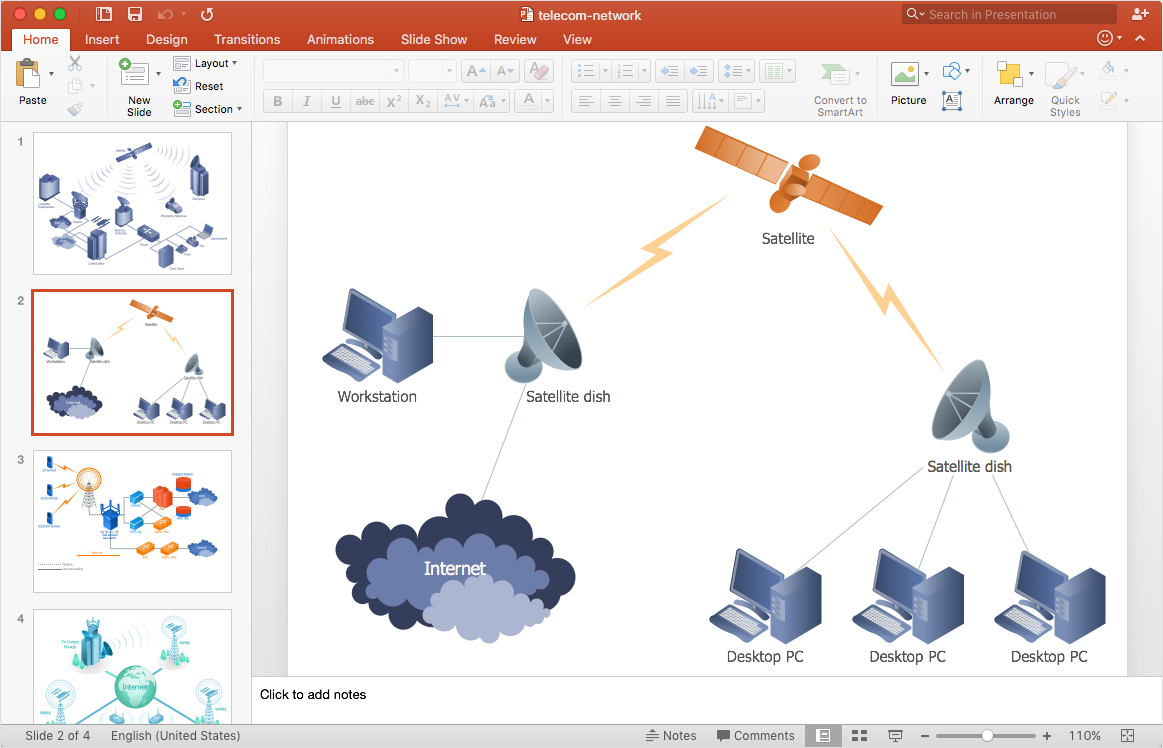
How to Add a Telecommunication Network Diagram to a PowerPoint Presentation
Telecommunication network diagram represents a system consisting of computers, servers, telecommunication devices, switches, satellites, wireless transmitters, antennas, cables, etc., that link a set of remote nodes. It also describes a telephone exchange, that connects calls between landlines. ConceptDraw DIAGRAM allows you to easily create telecommunication network diagrams and then make a PowerPoint Presentation from your network documentation in a few clicks. Telecommunication network diagrams are used to show components and connections in a telecommunications network: how they are interacted between each other and with end-users. The PowerPoint presentation on a conception of telecom network can be very informative and helpful. ConceptDraw DIAGRAM allows you to make an MS PowerPoint Presentation from your telecommunication network diagrams in a few clicks.HelpDesk
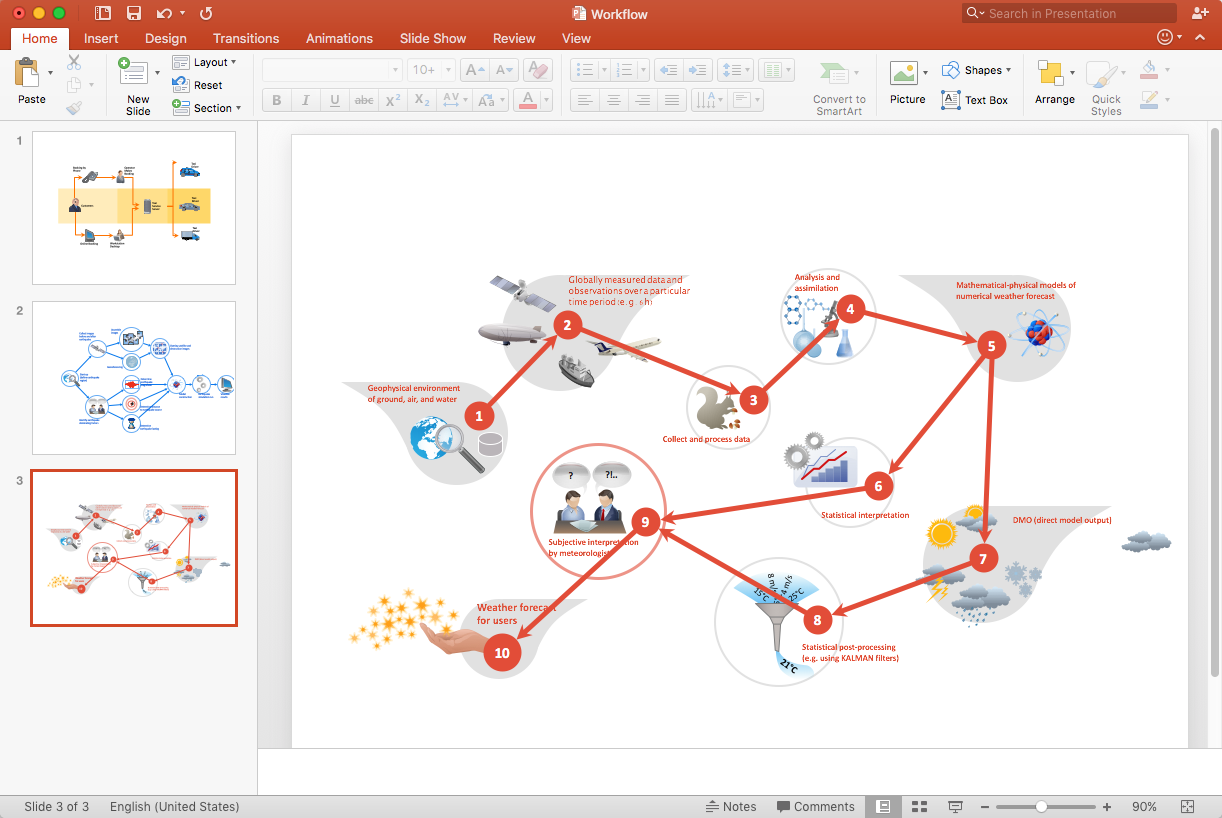
How to Add a Workflow Diagram to a PowerPoint Presentation
Making workflow diagrams in PowerPoint can help to describe the process within your organization as well as making comprehensive analysis presentations for sales or management and also can be used in other presentations and business documentation.HelpDesk
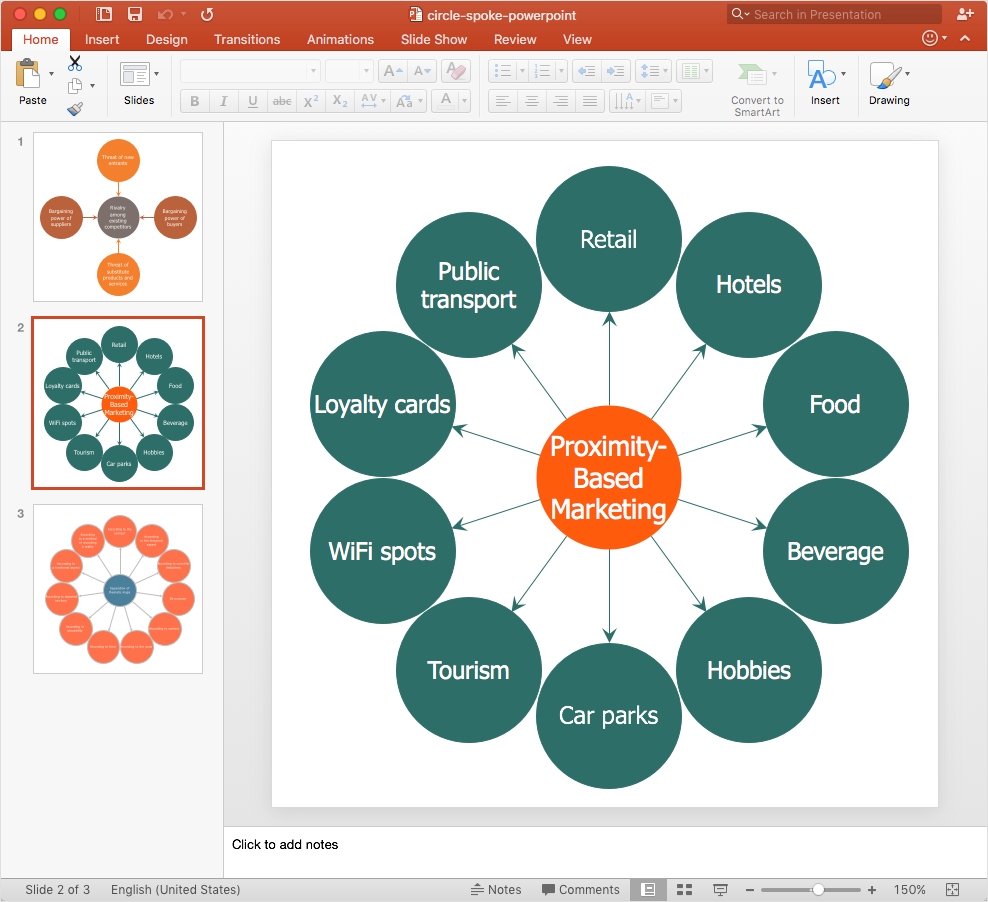
How to Add a Circle-spoke Diagram to PowerPoint
ConceptDraw DIAGRAM can be used as a tool for creating circle spoke diagrams along with other marketing diagrams. ConceptDraw DIAGRAM allows you to make a MS PowerPoint Presentation from your marketing diagrams in a few simple steps."The ideal telecommunication network has the following characteristics: broadband, multi-media, multi-point, multi-rate and economical implementation for a diversity of services (multi-services). The Broadband Integrated Services Digital Network (B-ISDN) intended to provide these characteristics. Asynchronous Transfer Mode (ATM) was promoted as a target technology for meeting these requirements" [Broadband networks. Wikipedia]
"Wireless broadband is technology that provides high-speed wireless Internet access or computer networking access over a wide area. ...
Wireless networks can feature data rates roughly equivalent to some wired networks, such as that of asymmetric digital subscriber line (ADSL) or a cable modem. Wireless networks can also be symmetrical, meaning the same rate in both directions (downstream and upstream), which is most commonly associated with fixed wireless networks. A fixed wireless network link is a stationary terrestrial wireless connection, which can support higher data rates for the same power as mobile or satellite systems.
Few wireless Internet service providers (WISPs) provide download speeds of over 100 Mbit/ s; most broadband wireless access (BWA) services are estimated to have a range of 50 km (31 mi) from a tower. Technologies used include LMDS and MMDS, as well as heavy use of the ISM bands and one particular access technology was standardized by IEEE 802.16, with products known as WiMAX." [Wireless broadband. Wikipedia]
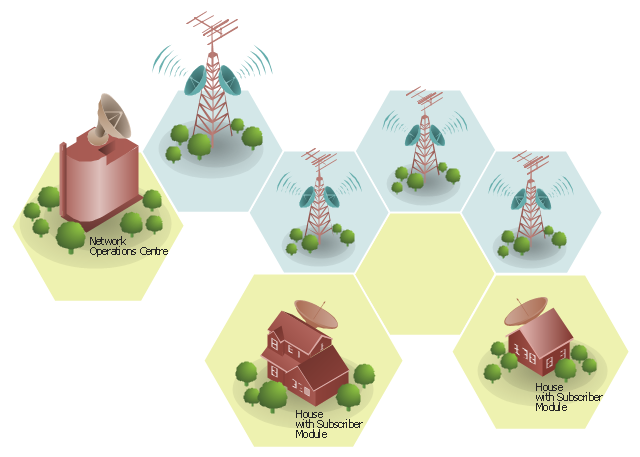
Wireless broadband is technology that provides high-speed wireless Internet access or computer networking access over a wide area. [Wireless broadband. Wikipedia]
This wireless broadband network diagram example was created using the ConceptDraw PRO diagramming and vector drawing software extended with the Telecommunication Network Diagrams solution from the Computer and Networks area of ConceptDraw Solution Park.
- Interactive Voice Response Diagrams | Management | Multi Banking ...
- How to Create a Venn Diagram in ConceptDraw PRO | Multi Layer ...
- Venn Diagrams | Venn Diagram Maker | Multi Layer Venn Diagram ...
- Venn Diagram Template for Word | Multi Layer Venn Diagram . Venn ...
- Multi Layer Venn Diagram . Venn Diagram Example | UML package ...
- How to Create a Venn Diagram in ConceptDraw PRO | Venn ...
- Multi Layer Venn Diagram . Venn Diagram Example | Business ...
- Uml Diagrams Of Multi Banking Syatem Download
- Use Case Diagram For Multi Banking System
- 3 Circle Venn Diagram . Venn Diagram Example | Multi Layer Venn ...
- Best Multi -Platform Diagram Software | How to Create a Business ...
- Best Multi -Platform Diagram Software | The Best Drawing Program ...
- Sequence Diagram For Multi Banking System
- Sequence Diagramfor Multi Banking System
- 5-Set Venn diagram - Template
- Use Case Diagram Of Multi Banking System Com
- 5-Set Venn diagram - Template | Multi Layer Venn Diagram . Venn ...
- Venn Diagrams | Venn Diagram | Multi Layer Venn Diagram . Venn ...
- Accounting Flowcharts | Simple & Fast Diagram Software | Best Multi ...
- Venn Diagram Template for Word | Logic gate diagram - Template ...


-data-flow-diagram-(dfd)---vector-stencils-library.png--diagram-flowchart-example.png)
-data-flow-diagram-(dfd)---vector-stencils-library.png--diagram-flowchart-example.png)
-data-flow-diagram-(dfd)---vector-stencils-library.png--diagram-flowchart-example.png)
---vector-stencils-library.png--diagram-flowchart-example.png)
---vector-stencils-library.png--diagram-flowchart-example.png)
---vector-stencils-library.png--diagram-flowchart-example.png)
---vector-stencils-library.png--diagram-flowchart-example.png)
---vector-stencils-library.png--diagram-flowchart-example.png)
---vector-stencils-library.png--diagram-flowchart-example.png)
-data-flow-diagram-(dfd)---vector-stencils-library.png--diagram-flowchart-example.png)
-data-flow-diagram-(dfd)---vector-stencils-library.png--diagram-flowchart-example.png)
---vector-stencils-library.png--diagram-flowchart-example.png)
---vector-stencils-library.png--diagram-flowchart-example.png)
---vector-stencils-library.png--diagram-flowchart-example.png)
-data-flow-diagram-(dfd)---vector-stencils-library.png--diagram-flowchart-example.png)

