 Sales Flowcharts
The Sales Flowcharts solution lets you create and display sales process maps, sales process workflows, sales steps, the sales process, and anything else involving sales process management.
HelpDesk
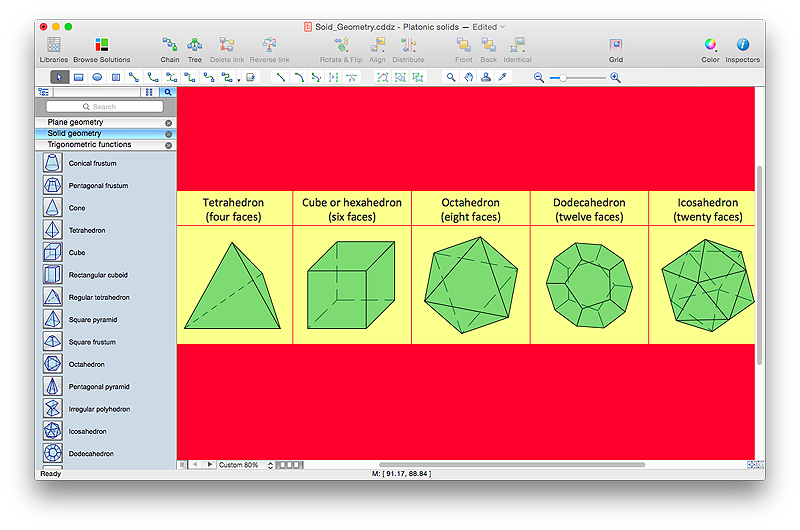
How to Draw Geometric Shapes in ConceptDraw PRO
Knowledge of geometry grants people good logic, abstract and spatial thinking skills. The object of study of geometry are the size, shape and position, the 2-dimensional and 3-dimensional shapes. Geometry is related to many other areas in math, and is used daily by engineers, architects, designers and many other professionals. Today, the objects of geometry are not only shapes and solids. It deals with properties and relationships and looks much more about analysis and reasoning. Geometry drawings can be helpful when you study the geometry, or need to illustrate the some investigation related to geometry. ConceptDraw PRO allows you to draw plane and solid geometry shapes quickly and easily.
 Business Package for Management
Package intended for professional who designing and documenting business processes, preparing business reports, plan projects and manage projects, manage organizational changes, prepare operational instructions, supervising specific department of an organization, workout customer service processes and prepare trainings for customer service personal, carry out a variety of duties to organize business workflow.
 Fishbone Diagrams
The Fishbone Diagrams solution extends ConceptDraw PRO v10 software with the ability to easily draw the Fishbone Diagrams (Ishikawa Diagrams) to clearly see the cause and effect analysis and also problem solving. The vector graphic diagrams produced using this solution can be used in whitepapers, presentations, datasheets, posters, and published technical material.
- Drawing Charts For Computer Practical
- How to Draw a Computer Network Diagrams | Flowchart design ...
- Names Of Solids Shapes
- Basic Flowchart Symbols and Meaning | Process Flowchart | Audit ...
- Computer Manufacturing Process Flow Chart
- How to Draw a Computer Network Diagrams | Process Flowchart ...
- Physics Diagrams | Basic Audit Flowchart . Flowchart Examples ...
- Process Flowchart | Cisco Security. Cisco icons, shapes , stencils ...
- How to Draw a Computer Network Diagrams | Personal area (PAN ...
- Flowchart design. Flowchart symbols, shapes , stencils and icons ...
- Practical Application Of Flowcharts
- Process Flowchart | Computer Network Diagrams | Cisco Multimedia ...
- Process Flowchart | Network Diagram Software LAN Network ...
- Basic Flowchart Symbols and Meaning | Euclidean algorithm ...
- Process Flowchart | How to Draw a Computer Network Diagrams ...
- Fishbone Diagrams | Types of Flowcharts | Computer and Networks ...
- Process Flowchart | How to Draw a Computer Network Diagrams ...
- UML Activity Diagram | Process Flowchart | UML Use Case Diagram ...
- Flowchart design. Flowchart symbols, shapes , stencils and icons ...
- Chemistry Practical Apparatus Name Images
