The vector stencils library "Landmarks" contains 69 landmark symbols of buildings, waterways, scale and directional indicators for labeling transportation and directional maps, road and route maps, street and transit maps, locator and tourist maps.
The pictograms example "Landmarks - Vector stencils library" was created using the ConceptDraw PRO diagramming and vector drawing software extended with the Directional Maps solution from the Maps area of ConceptDraw Solution Park.
The pictograms example "Landmarks - Vector stencils library" was created using the ConceptDraw PRO diagramming and vector drawing software extended with the Directional Maps solution from the Maps area of ConceptDraw Solution Park.
Viewpoint

North arrow
North arrow
Building

Building

Town house

Suburban home

Skyscraper

Town hall

Public house

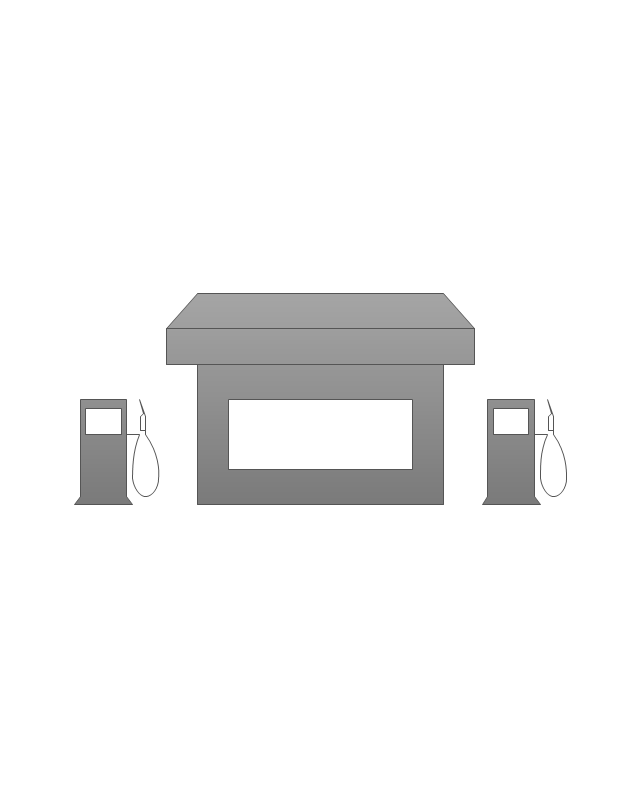
Petrol station
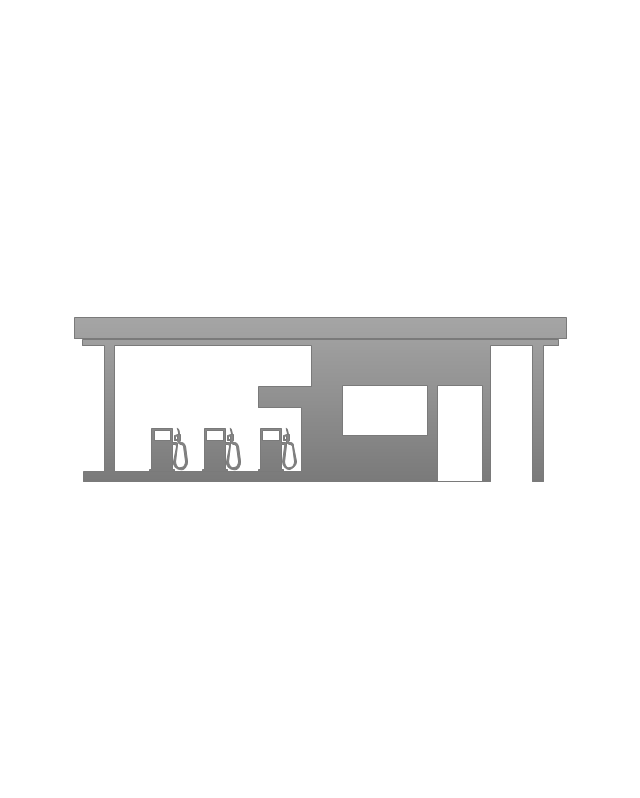
Gas station
Factory

School

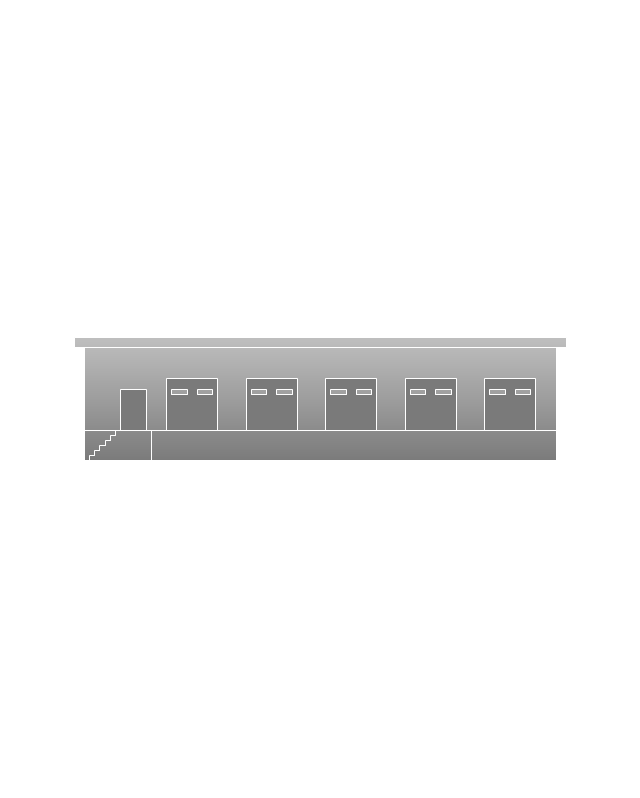
Warehouse
Hospital

Fire station

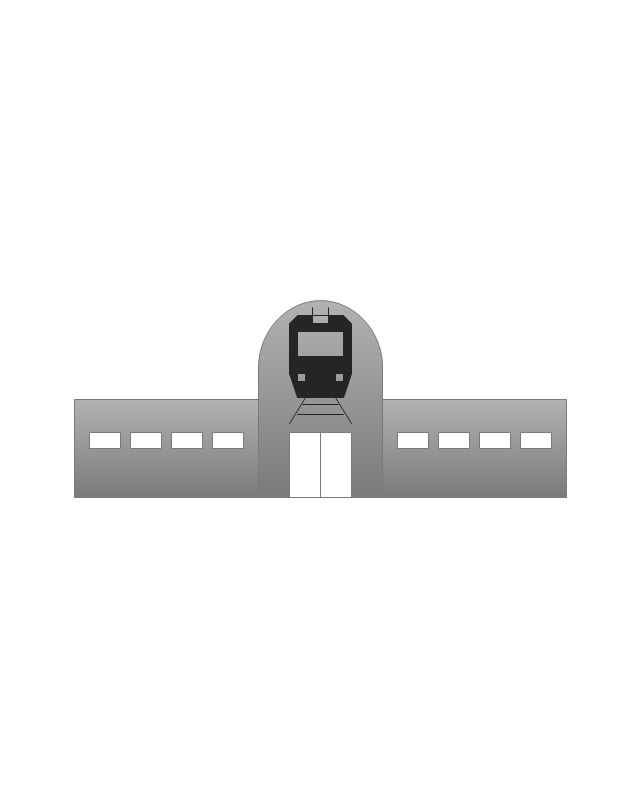
Train station
Condos

Barn

Motel

Convenience store

Shopping centre

City

Church

Cathedral

National tail train station
Train railway

Bus stop

Tramlink

Marina / Ferry dock

Car ferry

Stop light
Airport

Airport

Underground / Subway / Metro

Taxi

Bicycle parking

Parking

Fuel / Gas / Petrol
Police

Hospital

Wheelchair access

First aid

Telephone

Post office

Landmarks and museums

University

Shopping

Refreshments / Public House

Restrooms / Toilets

Park

Zoo

Information center

Stadium 1
Stadium 2
Park

Tree

Fir-tree

Ocean

Lake

River

Angled river

Forked river

Curved river

Curved river

Flexible river

Bridge

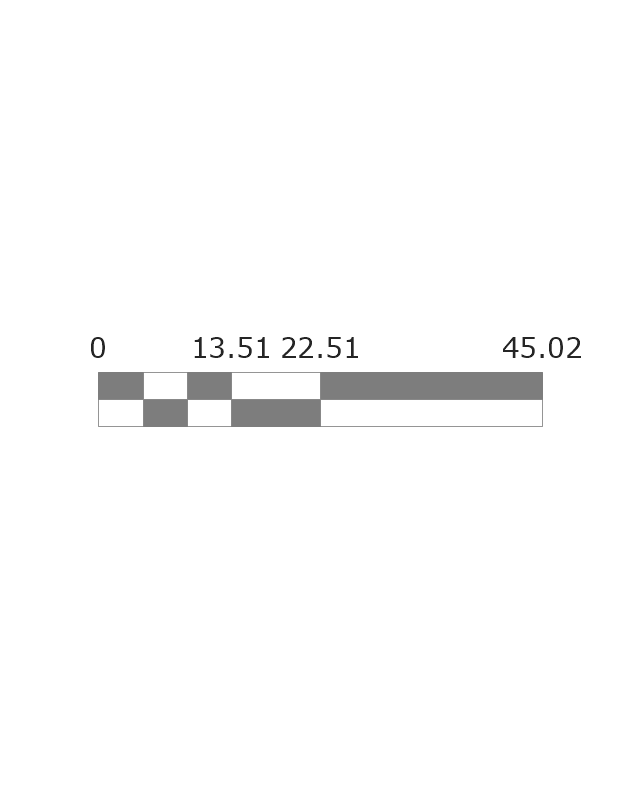
Scale
The vector stencils library "Transport map" contains 96 pictograms for drawing transport maps.
Use it in your spatial infographics for visual representation of transport schemes and plans as metro maps in the ConceptDraw PRO diagramming and vector drawing software extended with the Spatial Infographics solution from the area "What is Infographics" of ConceptDraw Solution Park.
Use it in your spatial infographics for visual representation of transport schemes and plans as metro maps in the ConceptDraw PRO diagramming and vector drawing software extended with the Spatial Infographics solution from the area "What is Infographics" of ConceptDraw Solution Park.
Train Railway

Bus Stop

Tramlink

Marina/Ferry Dock

Information Center

Information Center

Airport

Airport

Underground/Subway/Metro

Underground/Subway/Metro

National Rail Train Station

Taxi

Taxi

Parking

Parking

Parking

Parking

Bicycle Parking

Bicycle Parking

Fuel/Gas/Petrol
Fuel/Gas/Petrol

Police

Police

Hospital

Hospital

Wheelchair Access

Wheelchair Access

First Aid

First Aid

Telephone

Telephone

Post Office

Post Office

Landmarks and Museums

Landmarks and Museums

University

University

Shopping/Supermarket

Shopping/Supermarket

Cafe

Cafe

Food and Drinks

Food and Drinks

Man

Woman

Restrooms/Toilets

Restrooms/Toilets

Park

Park

Zoo

Zoo

Hotel

Hotel

Camping

Camping

City

Skyscraper

Building

Ocean

Straight River

Flexible River

Bridge

North Arrow
Viewpoint

Scale

Road line

Road rounded line

Road corner

Road curve 1

Road curve 2

Crossroads

Roundabout

Cloverleaf interchange

Roadway break

Railway line

Railway curve

Railway fork

Standard line with standard station - basic road

Thick line with standard station - basic road

Standard line with rectangular station - basic road

Thick line with rectangular station - basic road

Standard line with standard station - double road

Thick line with standard station - double road

Standard line with rectangular station - double road

Thick line with rectangular station - double road

Standard line with standard station - dotted road

Thick line with standard station - dotted road

Standard line with rectangular station - dotted road

Thick line with rectangular station - dotted road

Interchange Station Vertical

Interchange Station Horizontal

Transfer Station 1

Transfer Station 2

Transfer Station 3

Line Notation

Street direction

The vector stencils library "Landmarks" contains 69 landmark symbols of buildings, waterways, scale and directional indicators for labeling transportation and directional maps, road and route maps, street and transit maps, locator and tourist maps.
The pictograms example "Landmarks - Vector stencils library" was created using the ConceptDraw PRO diagramming and vector drawing software extended with the Directional Maps solution from the Maps area of ConceptDraw Solution Park.
The pictograms example "Landmarks - Vector stencils library" was created using the ConceptDraw PRO diagramming and vector drawing software extended with the Directional Maps solution from the Maps area of ConceptDraw Solution Park.
Viewpoint
North arrow
North arrow
Building
Building
Town house
Suburban home
Skyscraper
Town hall
Public house
Petrol station
Gas station
Factory
School
Warehouse
Hospital
Fire station
Train station
Condos
Barn
Motel
Convenience store
Shopping centre
City
Church
Cathedral
National tail train station
Train railway
Bus stop
Tramlink
Marina / Ferry dock
Car ferry
Stop light
Airport
Airport
Underground / Subway / Metro
Taxi
Bicycle parking
Parking
Fuel / Gas / Petrol
Police
Hospital
Wheelchair access
First aid
Telephone
Post office
Landmarks and museums
University
Shopping
Refreshments / Public House
Restrooms / Toilets
Park
Zoo
Information center
Stadium 1
Stadium 2
Park
Tree
Fir-tree
Ocean
Lake
River
Angled river
Forked river
Curved river
Curved river
Flexible river
Bridge
Scale
"There are a growing number of books, websites and works of art on the subject of urban rail and metro map design and use. There are now hundreds of examples of diagrams in an urban rail or metro map style that are used to represent everything from other transit networks like buses and national rail services to sewerage systems and Derbyshire public houses.
One of the most well-known adaptations of an urban rail map was The Great Bear by Simon Patterson. First shown in 1992 nominated for the Turner Prize The Great Bear replaces station names on the London Underground map with those of explorers, saints, film stars, philosophers and comedians. Other artists such as Scott Rosenbaum, and Ralph Gray have also taken the iconic style of the urban rail map and made new artistic creations ranging from the abstract to the solar system. Following the success of these the idea of adapting other urban rail and metro maps has spread so that now almost every major subway or rapid transit system with a map has been doctored with different names, often anagrams of the original station name." [Transit map. Wikipedia]
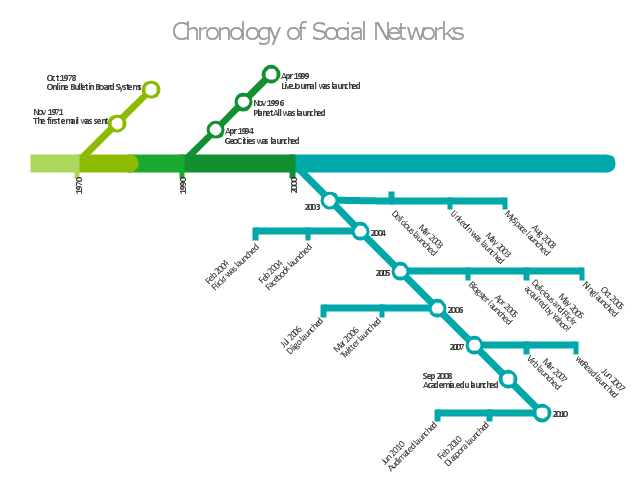
The infographics example "Chronology of social networks" was created using the ConceptDraw PRO diagramming and vector drawing software extended with the Metro Map solution from the Maps area of ConceptDraw Solution Park.
One of the most well-known adaptations of an urban rail map was The Great Bear by Simon Patterson. First shown in 1992 nominated for the Turner Prize The Great Bear replaces station names on the London Underground map with those of explorers, saints, film stars, philosophers and comedians. Other artists such as Scott Rosenbaum, and Ralph Gray have also taken the iconic style of the urban rail map and made new artistic creations ranging from the abstract to the solar system. Following the success of these the idea of adapting other urban rail and metro maps has spread so that now almost every major subway or rapid transit system with a map has been doctored with different names, often anagrams of the original station name." [Transit map. Wikipedia]
The infographics example "Chronology of social networks" was created using the ConceptDraw PRO diagramming and vector drawing software extended with the Metro Map solution from the Maps area of ConceptDraw Solution Park.
Infographics
"A transit map is a topological map in the form of a schematic diagram used to illustrate the routes and stations within a public transport system - whether this be bus lines, tramways, rapid transit, commuter rail or ferry routes. The main components are color coded lines to indicate each line or service, with named icons to indicate stations or stops. ...
There are a growing number of books, websites and works of art on the subject of urban rail and metro map design and use. There are now hundreds of examples of diagrams in an urban rail or metro map style that are used to represent everything from other transit networks like buses and national rail services to sewerage systems and Derbyshire public houses." [Transit map. Wikipedia]
The transportation map template for the ConceptDraw PRO diagramming and vector drawing software is included in the Spatial Infographics solution from the area "What is Infographics" of ConceptDraw Solution Park.
Transit map
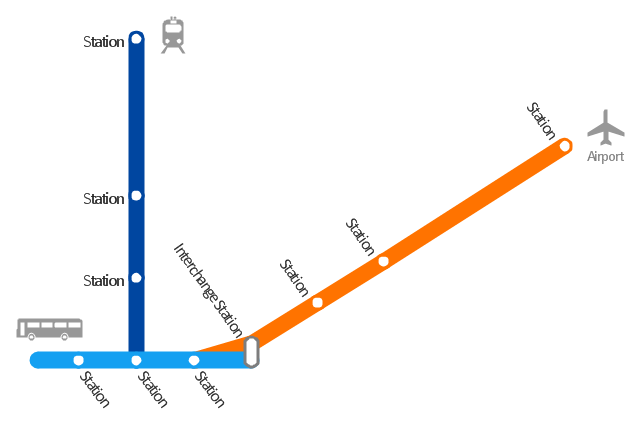
The vector stencils library "Transport map" contains 96 pictograms for drawing transport maps.
Use it in your spatial infographics for visual representation of transport schemes and plans as metro maps in the ConceptDraw PRO diagramming and vector drawing software extended with the Spatial Infographics solution from the area "What is Infographics" of ConceptDraw Solution Park.
Use it in your spatial infographics for visual representation of transport schemes and plans as metro maps in the ConceptDraw PRO diagramming and vector drawing software extended with the Spatial Infographics solution from the area "What is Infographics" of ConceptDraw Solution Park.
Train Railway
Bus Stop
Tramlink
Marina/Ferry Dock
Information Center
Information Center
Airport
Airport
Underground/Subway/Metro
Underground/Subway/Metro
National Rail Train Station
Taxi
Taxi
Parking
Parking
Parking
Parking
Bicycle Parking
Bicycle Parking
Fuel/Gas/Petrol
Fuel/Gas/Petrol
Police
Police
Hospital
Hospital
Wheelchair Access
Wheelchair Access
First Aid
First Aid
Telephone
Telephone
Post Office
Post Office
Landmarks and Museums
Landmarks and Museums
University
University
Shopping/Supermarket
Shopping/Supermarket
Cafe
Cafe
Food and Drinks
Food and Drinks
Man
Woman
Restrooms/Toilets
Restrooms/Toilets
Park
Park
Zoo
Zoo
Hotel
Hotel
Camping
Camping
City
Skyscraper
Building
Ocean
Straight River
Flexible River
Bridge
North Arrow
Viewpoint
Scale
Road line
Road rounded line
Road corner
Road curve 1
Road curve 2
Crossroads
Roundabout
Cloverleaf interchange
Roadway break
Railway line
Railway curve
Railway fork
Standard line with standard station - basic road
Thick line with standard station - basic road
Standard line with rectangular station - basic road
Thick line with rectangular station - basic road
Standard line with standard station - double road
Thick line with standard station - double road
Standard line with rectangular station - double road
Thick line with rectangular station - double road
Standard line with standard station - dotted road
Thick line with standard station - dotted road
Standard line with rectangular station - dotted road
Thick line with rectangular station - dotted road
Interchange Station Vertical
Interchange Station Horizontal
Transfer Station 1
Transfer Station 2
Transfer Station 3
Line Notation
Street direction
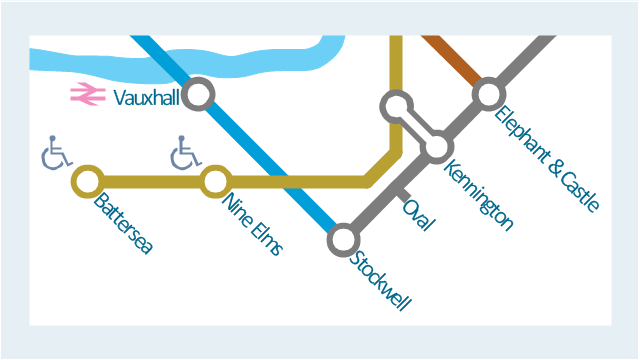
This spatial infographic example was created on the base of the tube map from the Transport for London website.
[tfl.gov.uk/ assets/ images/ general/ 24746-nle-gallery-tube-map.jpg]
"The Tube map is a schematic transit map of the lines and stations of London's public rapid transit railway systems, namely the London Underground (commonly known as the Tube, hence the name), Docklands Light Railway, London Overground and Emirates Air Line, as well as being incorporated into Greater London connections maps.
As a schematic diagram, it shows not necessarily the geographic but rather the relative positions of stations along the lines, stations' connective relations with each other and fare zones. The basic design concepts have been widely adopted for other network maps around the world, especially that of mapping topologically rather than geographically." [Tube map. Wikipedia]
The spatial infographics example "Metro map - Northern line extension to Battersea via Nine Elms" was created using the ConceptDraw PRO diagramming and vector drawing software extended with the Spatial Infographics solution from the area "What is Infographics" of ConceptDraw Solution Park.
Tube map
This area chart sample shows the population growth of San Francisco, California from 1850-2005. It was redesigned from the Wikimedia Commons file: San Francisco CA Population Growth.svg. [commons.wikimedia.org/ wiki/ File:San_ Francisco_ CA_ Population_ Growth.svg]
"The San Francisco Bay Area, commonly known as the Bay Area, is a populated region that surrounds the San Francisco and San Pablo estuaries in Northern California, United States. The region encompasses the major cities and metropolitan areas of San Francisco, Oakland, and San Jose, along with smaller urban and rural areas. The Bay Area's nine counties are Alameda, Contra Costa, Marin, Napa, San Francisco, San Mateo, Santa Clara, Solano, and Sonoma. Home to approximately 7.44 million people, the nine-county Bay Area contains many cities, towns, airports, and associated regional, state, and national parks, connected by a network of roads, highways, railroads, bridges, tunnels and commuter rail. The combined urban area of San Francisco and San Jose is the second largest in California (after the Greater Los Angeles area), the fifth largest in the United States, and the 56th largest urban area in the world." [San Francisco Bay Area. Wikipedia]
The area graph example "San Francisco CA Population Growth" was created using the ConceptDraw PRO diagramming and vector drawing software extended with the Area Charts solution from the Graphs and Charts area of ConceptDraw Solution Park.
Area chart

AWS Simple Icons for Architecture Diagrams

Rainfall Bar Chart

- Urban Railway Vector Png
- Train Station View Vector Png
- Metro Rail Png
- Traffic Light Cartoon Png
- Hospital Building Png Vector
- Bus Station Icon Vector Png
- Share Double Arrow Vector Png
- Bullet Trains Png
- Landmarks - Vector stencils library
- Rail transport - Design elements | Rail transport - Vector stencils ...