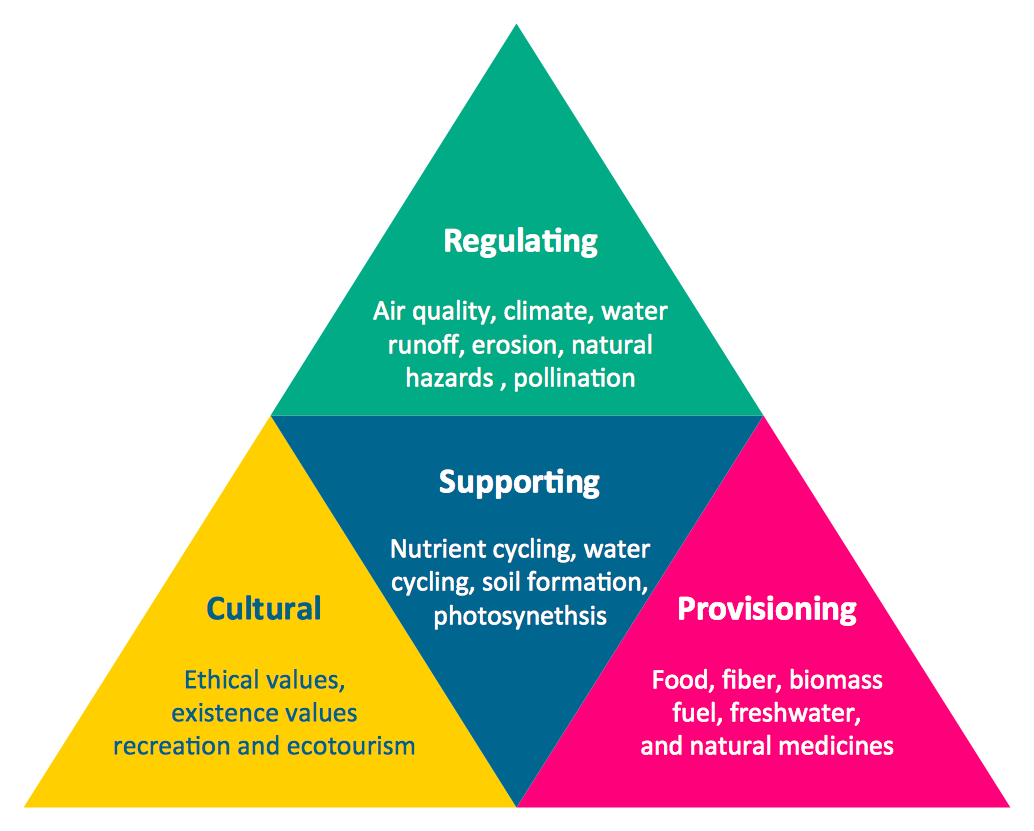
"Ecosystems represent sources of natural capital and provide goods and services to society, also called ecosystem services. The Millennium Ecosystem Assessment identified over 24 ecosystem services that can be divided up into 4 general groups including: 1) provisioning, 2) supporting, 3) regulating and 4) cultural." [User:Sawtoothgirl/ Sustainable Real Estate Development. Wikipedia]
"Humankind benefits in a multitude of ways from ecosystems. Collectively, these benefits are known as ecosystem services. Ecosystem services are regularly involved in the provisioning of clean drinking water and the decomposition of wastes. While scientists and environmentalists have discussed ecosystem services implicitly for decades, these the ecosystem services concept itself was popularized by the Millennium Ecosystem Assessment (MA) in the early 2000s. This grouped ecosystem services into four broad categories: provisioning, such as the production of food and water; regulating, such as the control of climate and disease; supporting, such as nutrient cycles and crop pollination; and cultural, such as spiritual and recreational benefits. To help inform decision-makers, many ecosystem services are being assigned economic values." [Ecosystem services. Wikipedia]
The segmented pyramid diagram example "Ecosystem goods and services" was redesigned using the ConceptDraw PRO diagramming and vector drawing software from Wikimedia Commons file ES_ triangle.png.
[commons.wikimedia.org/ wiki/ File:ES_ triangle.png]
This file is licensed under the Creative Commons Attribution-Share Alike 3.0 Unported license. [creativecommons.org/ licenses/ by-sa/ 3.0/ deed.en]
This segmented pyramid diagram example "Ecosystem goods and services" is included in the Pyramid Diagrams solution from the Marketing area of ConceptDraw Solution Park.
Pyramid diagram

 Pie Charts
Pie Charts are extensively used in statistics and business for explaining data and work results, in mass media for comparison (i.e. to visualize the percentage for the parts of one total), and in many other fields. The Pie Charts solution for ConceptDraw DIAGRAM offers powerful drawing tools, varied templates, samples, and a library of vector stencils for simple construction and design of Pie Charts, Donut Chart, and Pie Graph Worksheets.
 Divided Bar Diagrams
The Divided Bar Diagrams Solution extends the capabilities of ConceptDraw DIAGRAM with templates, samples, and a library of vector stencils for drawing high impact and professional Divided Bar Diagrams and Graphs, Bar Diagram Math, and Stacked Graph.
Process Diagrams
Affinity Diagram

Beauty in nature Illustrations and Clipart

Pyramid Chart Examples
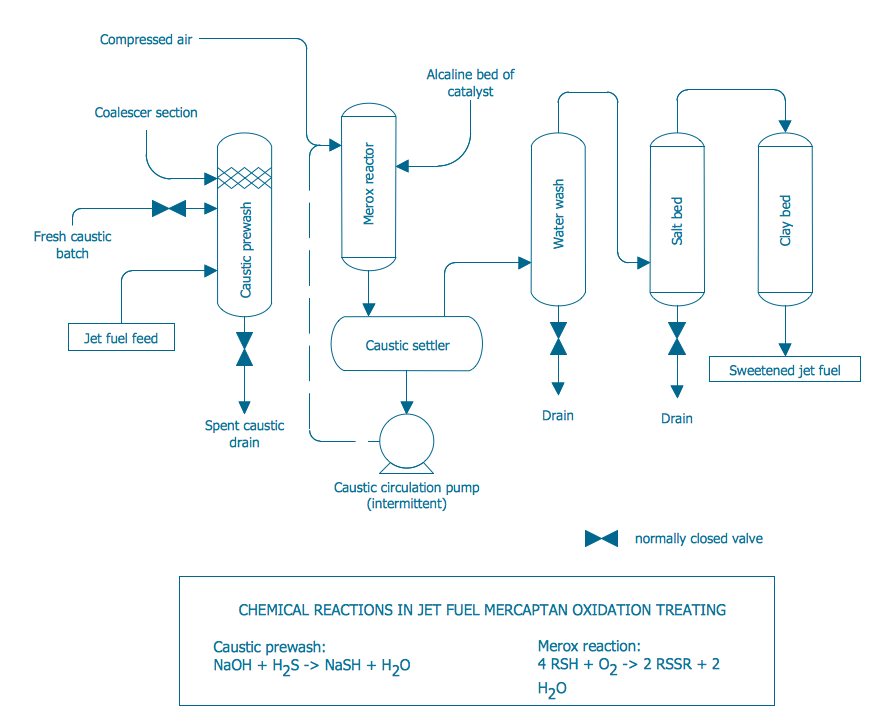
Process Flow Diagram

DFD Library — Design elements

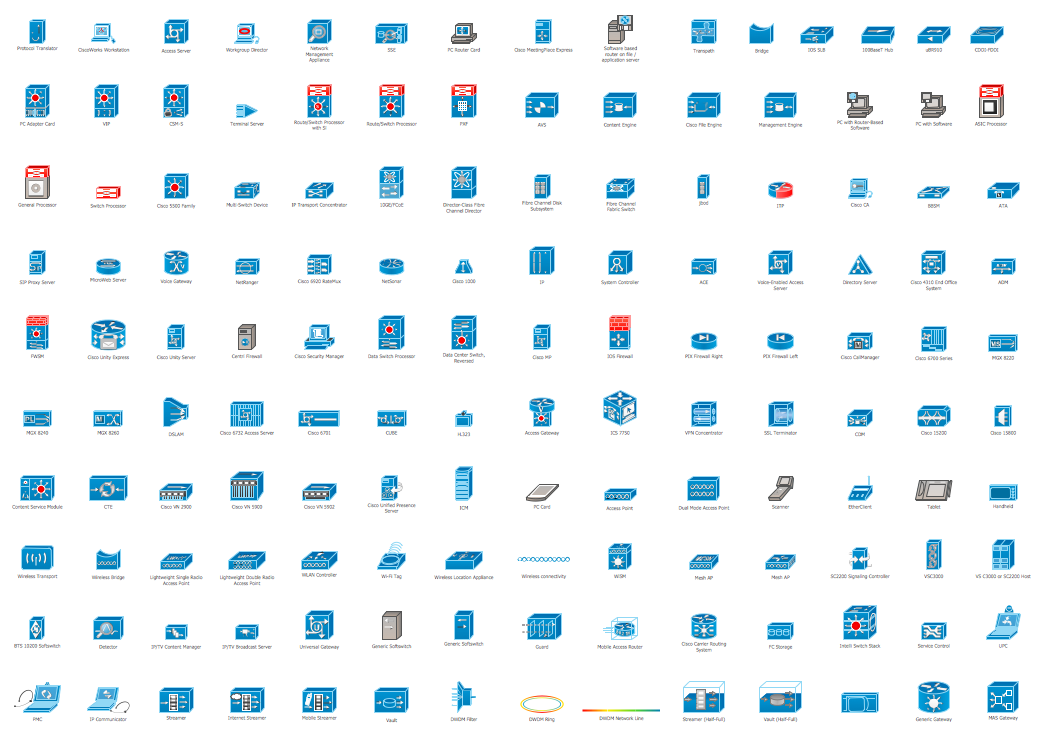
Cisco Products Additional. Cisco icons, shapes, stencils and symbols
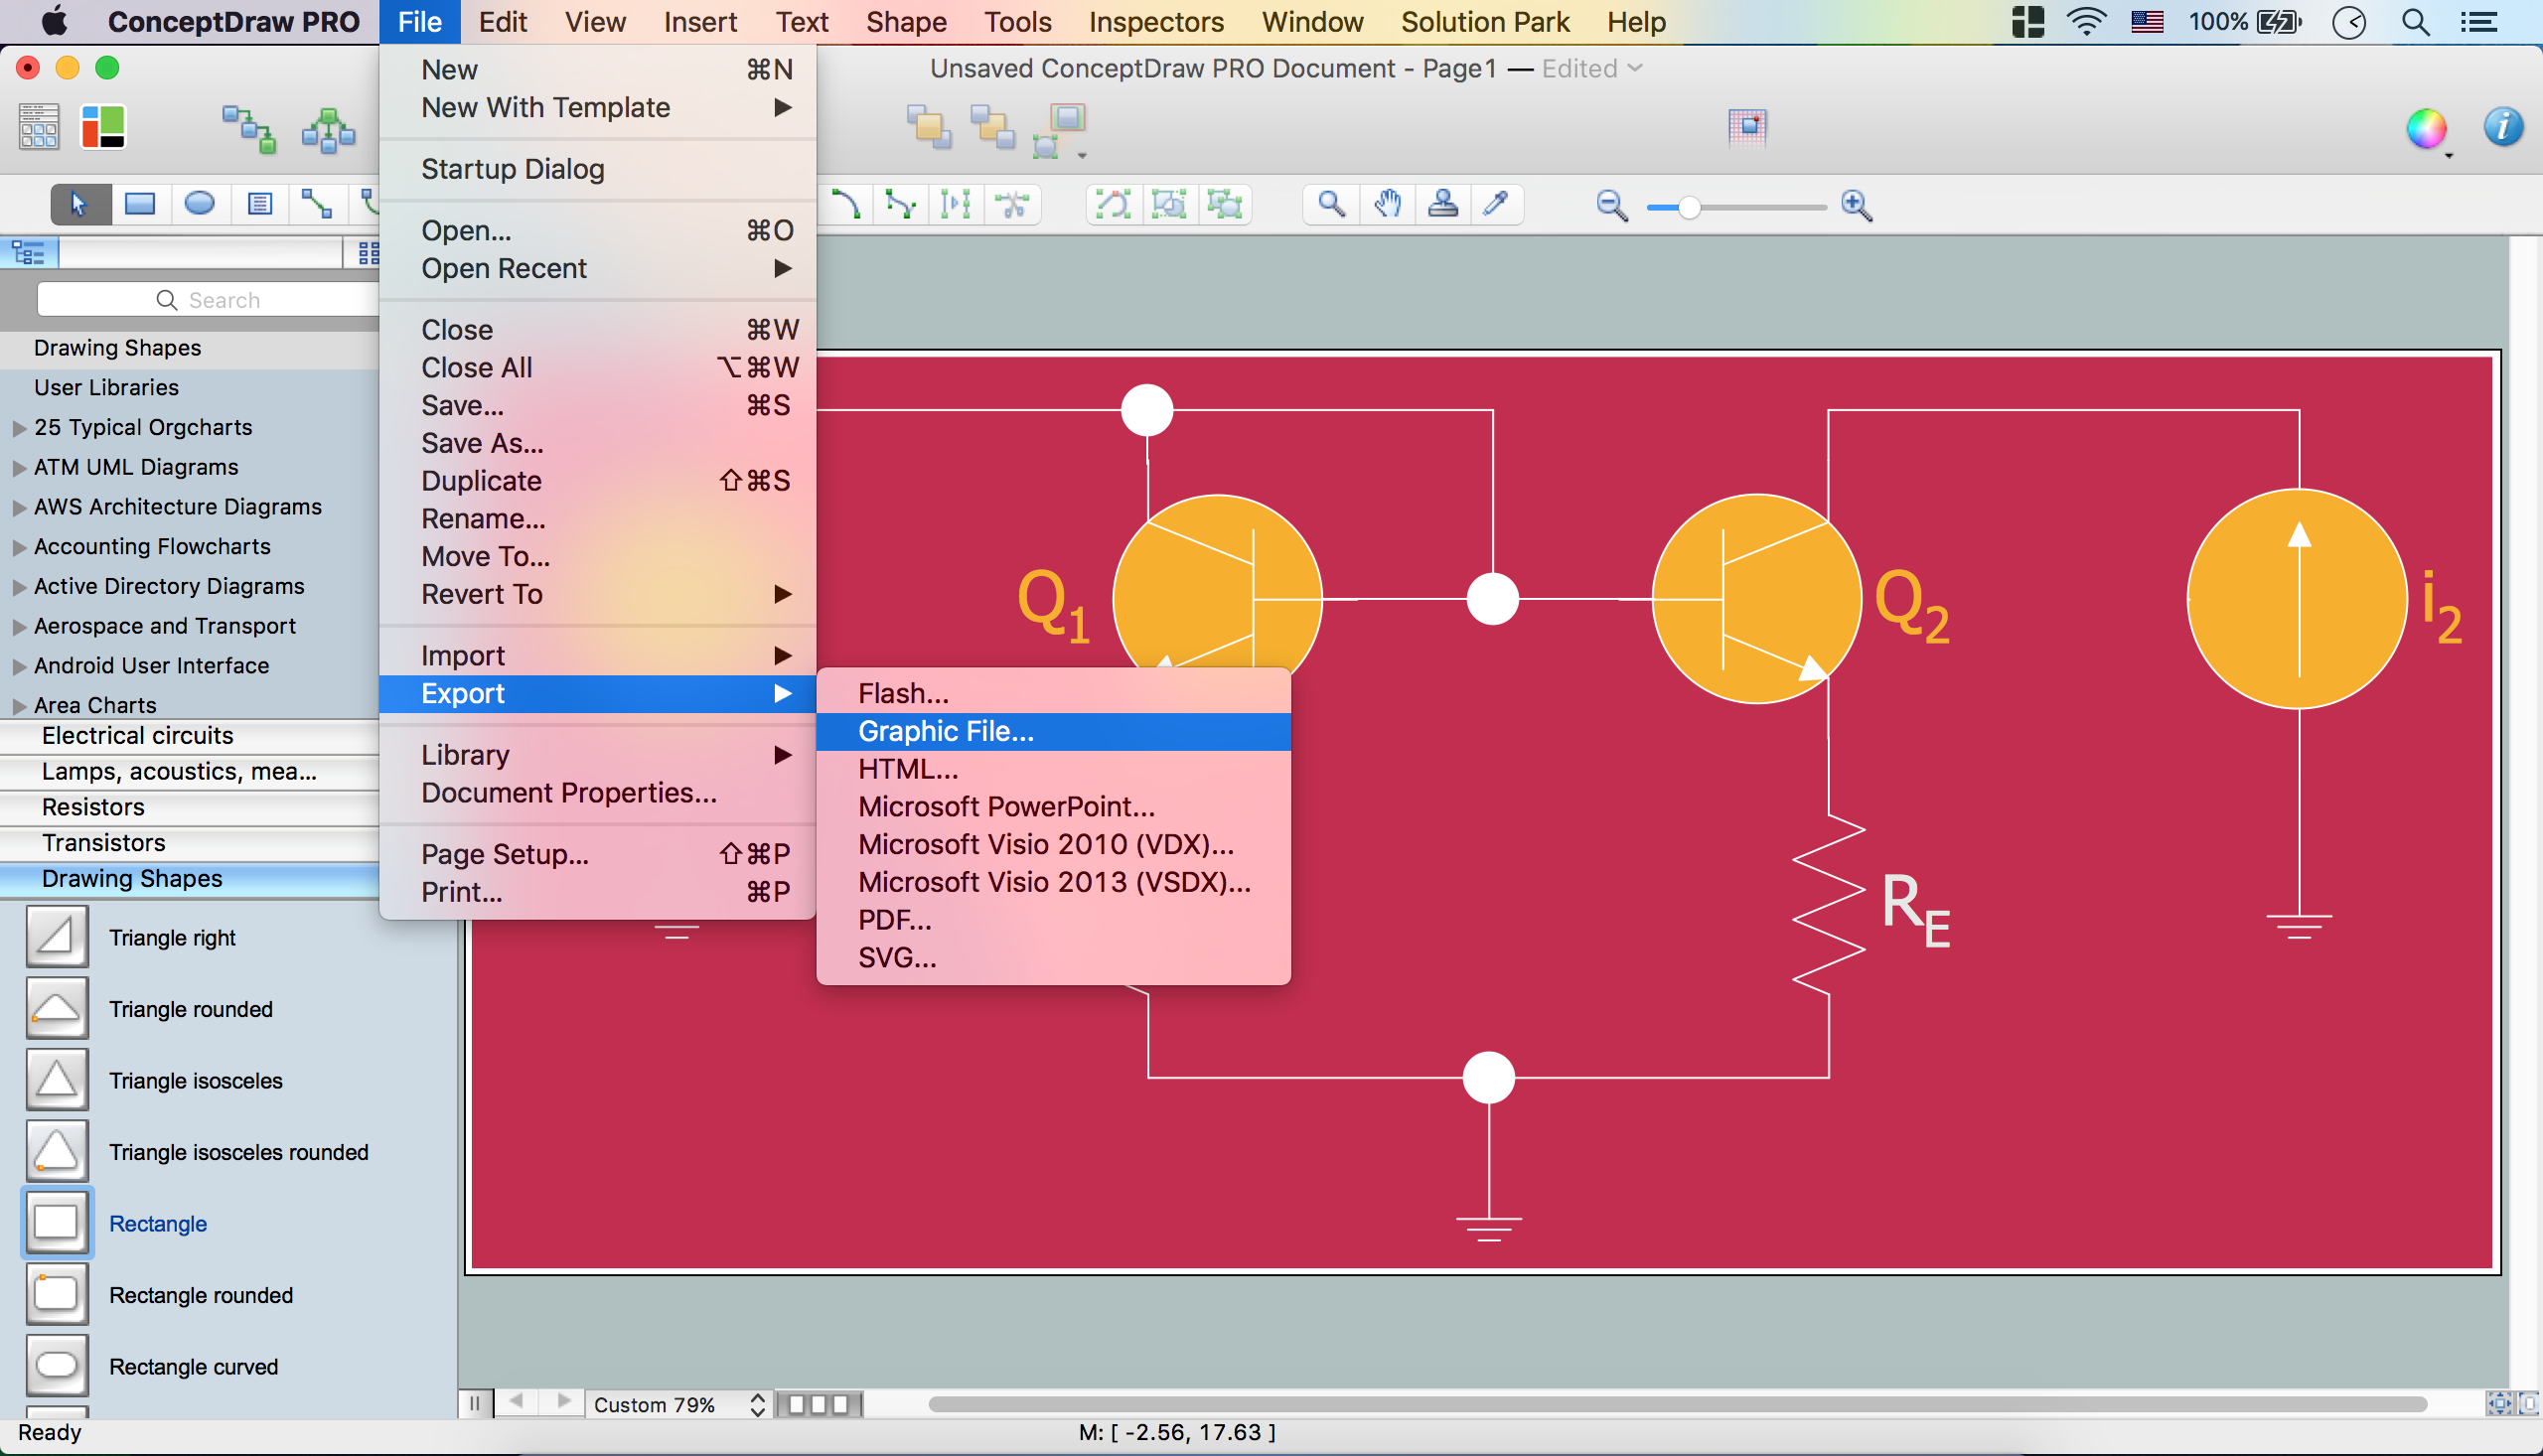
Electrical Diagram Software

Process Flow Diagram Symbols

ConceptDraw DIAGRAM Compatibility with MS Visio

Emergency Plan


FSM — Finite-state Machine
- Energy Pyramid Diagram
- Resources and energy - Vector stencils library | Energy resources ...
- Energy resources diagram | Design elements - Power sources ...
- Diagram Of Renewable Solar Energy Sources
- Energy Pyramid Diagram | Energy resources diagram | U.S. energy ...
- Natural gas condensate - PFD | Bar Diagram Math | Affinity Diagram ...
- Water cycle diagram | Active indirect water heater diagram | Piping ...
- Resources and energy - Vector stencils library | Energy resources ...
- Energy Pyramid Diagram | Design elements - Power sources | How ...
- Energy Sources Diagram
- Design elements - Power sources | Electrical Symbols — Power ...
- Energy Pyramid Diagram | How to Create a Scatter Chart | U.S. ...
- Energy resources diagram | Manufacturing and Maintenance | Life ...
- Electrical Symbols — Power Sources | Types of Flowcharts | Design ...
- Renewable energy | Energy resources diagram | Vector Map of ...
- Drawings And Diagrams For Conventional Sources Of Energy
- Active indirect water heater diagram | Resources and energy ...
- Energy resources diagram | Resources and energy - Vector stencils ...
- Form Maker | How to Draw a Natural Landscape | Process Diagrams ...
- Energy Pyramid Diagram | Scatter Chart Examples | Chart Examples ...