Network Diagram Examples


Draw Network Diagram based on Templates and Examples

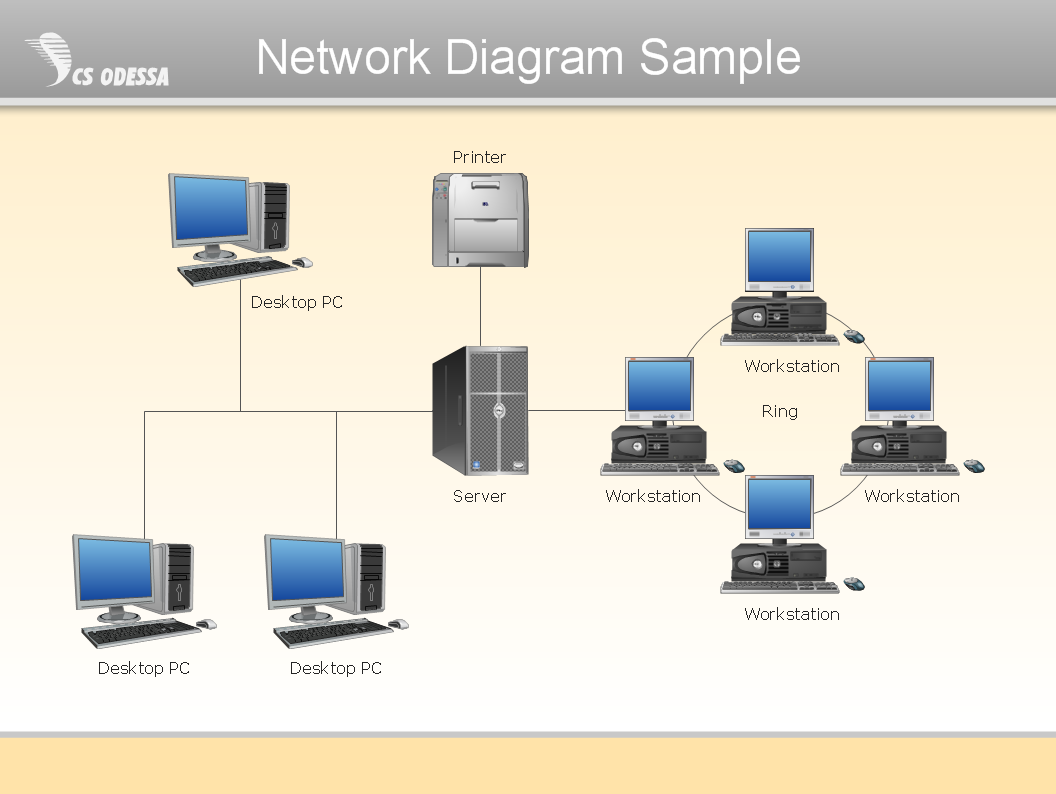
 Computer Network Diagrams
Computer Network Diagrams solution extends ConceptDraw DIAGRAM software with samples, templates and libraries of vector icons and objects of computer network devices and network components to help you create professional-looking Computer Network Diagrams, to plan simple home networks and complex computer network configurations for large buildings, to represent their schemes in a comprehensible graphical view, to document computer networks configurations, to depict the interactions between network's components, the used protocols and topologies, to represent physical and logical network structures, to compare visually different topologies and to depict their combinations, to represent in details the network structure with help of schemes, to study and analyze the network configurations, to communicate effectively to engineers, stakeholders and end-users, to track network working and troubleshoot, if necessary.
Campus Area Networks (CAN). Computer and Network Examples

Network Diagram Software Physical Network Diagram
Metropolitan area networks (MAN). Computer and Network Examples
. Computer and Network Examples")
Entity Relationship Diagram - ERD - Software for Design Crows Foot ER Diagrams
_Win_Mac.png)

Venn Diagram Examples for Problem Solving. Computer Science. Chomsky Hierarchy

Entity Relationship Diagram Examples

Data Flow Diagram Examples

- Examples Of Networking Building Plans
- Entity Relationship Diagram Exercises And Answers
- Entity-Relationship Diagram (ERD) | Network Diagram Software ...
- Sport Field Plans | IDEF0 Diagrams | Network Diagram Examples ...
- Construct Network Diagram Example Pdf
- Entity-Relationship Diagram (ERD) | Computer Network Diagrams ...
- Entity-Relationship Diagram (ERD) | Network Diagram Software ...
- Entity-Relationship Diagram (ERD) | Accounting Flowcharts ...
- Network Diagram Software Logical Network Diagram