 Computer Network Diagrams
Computer Network Diagrams solution extends ConceptDraw DIAGRAM software with samples, templates and libraries of vector icons and objects of computer network devices and network components to help you create professional-looking Computer Network Diagrams, to plan simple home networks and complex computer network configurations for large buildings, to represent their schemes in a comprehensible graphical view, to document computer networks configurations, to depict the interactions between network's components, the used protocols and topologies, to represent physical and logical network structures, to compare visually different topologies and to depict their combinations, to represent in details the network structure with help of schemes, to study and analyze the network configurations, to communicate effectively to engineers, stakeholders and end-users, to track network working and troubleshoot, if necessary.
Network Diagram Examples


How to Draw a Computer Network Diagrams

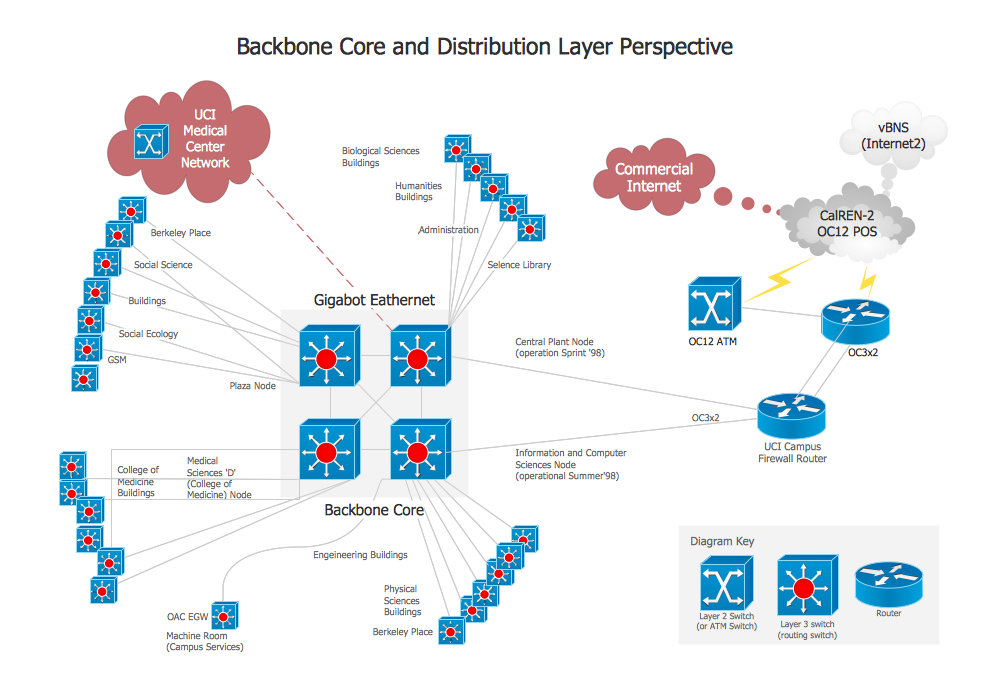
Network Diagram Software Backbone Network
 Event-driven Process Chain Diagrams
Event-Driven Process Chain Diagrams solution extends ConceptDraw DIAGRAM functionality with event driven process chain templates, samples of EPC engineering and modeling the business processes, and a vector shape library for drawing the EPC diagrams and EPC flowcharts of any complexity. It is one of EPC IT solutions that assist the marketing experts, business specialists, engineers, educators and researchers in resources planning and improving the business processes using the EPC flowchart or EPC diagram. Use the EPC solutions tools to construct the chain of events and functions, to illustrate the structure of a business process control flow, to describe people and tasks for execution the business processes, to identify the inefficient businesses processes and measures required to make them efficient.
, t chart, decision matrix, decision tree analysis") Decision Making
Decision Making
The Decision Making solution offers the set of professionally developed examples, powerful drawing tools and a wide range of libraries with specific ready-made vector decision icons, decision pictograms, decision flowchart elements, decision tree icons, decision signs arrows, and callouts, allowing the decision maker (even without drawing and design skills) to easily construct Decision diagrams, Business decision maps, Decision flowcharts, Decision trees, Decision matrix, T Chart, Influence diagrams, which are powerful in questions of decision making, holding decision tree analysis and Analytic Hierarchy Process (AHP), visual decomposition the decision problem into hierarchy of easily comprehensible sub-problems and solving them without any efforts.
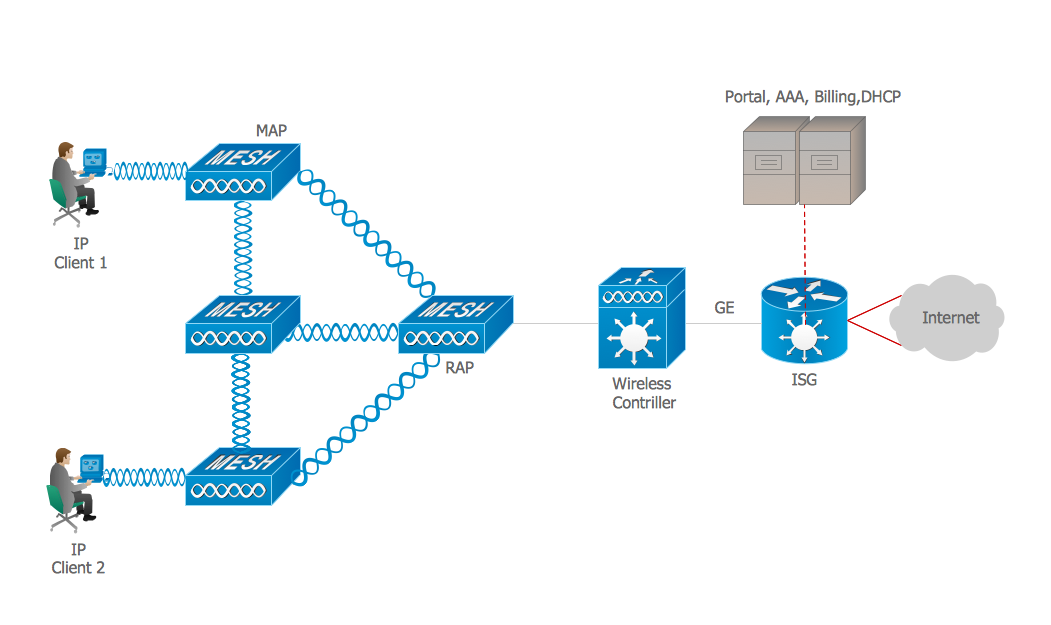
Intelligent Services Gateway (ISG) network. Computer and Network Examples
Fishbone Diagram Problem Solving

Using Fishbone Diagrams for Problem Solving

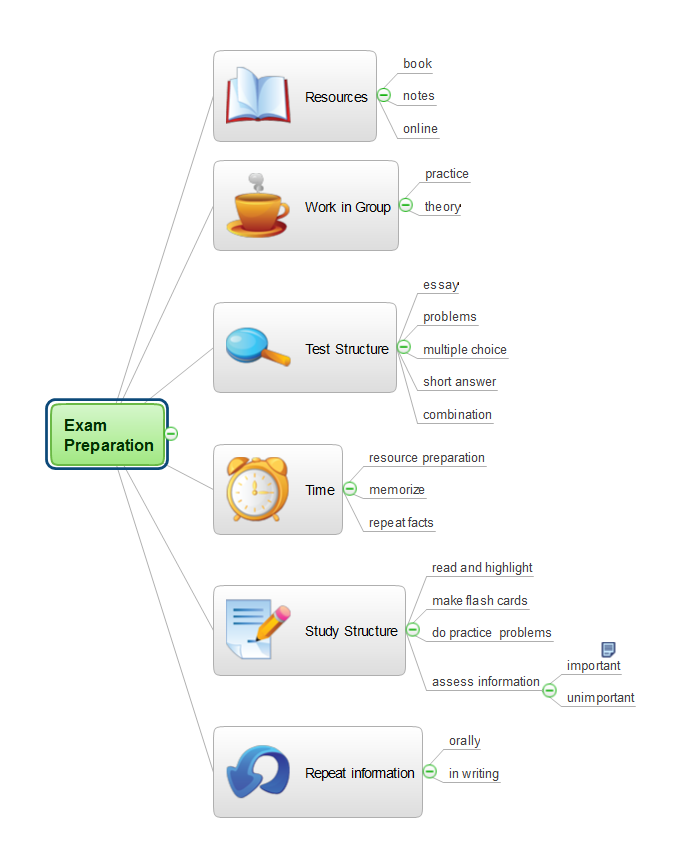
Exam Preparation Mind Map
- Network Diagram Problems With Solutions
- PERT Chart | Activity Network Diagram Method | Critical Path ...
- Root cause analysis tree diagram - Manufacturing problem solution ...
- Network Diagram Examples | Root cause analysis tree diagram ...
- Network Diagrams In Engineering Economics
- Networks And Graphs Program Evaluation And Review Technique
- PERT chart - Sale problem solution | Seven Management and ...
- The Best Choice for Creating Diagram | Concept Mapping ...
- Network Diagram Software IVR Services | Basic Flowchart Symbols ...
- Information Transfer Tree Diagram With Answer