 Fishbone Diagrams
The Fishbone Diagrams solution extends ConceptDraw DIAGRAM software with the ability to easily draw the Fishbone Diagrams (Ishikawa Diagrams) to clearly see the cause and effect analysis and also problem solving. The vector graphic diagrams produced using this solution can be used in whitepapers, presentations, datasheets, posters, and published technical material.
Network Diagram Examples
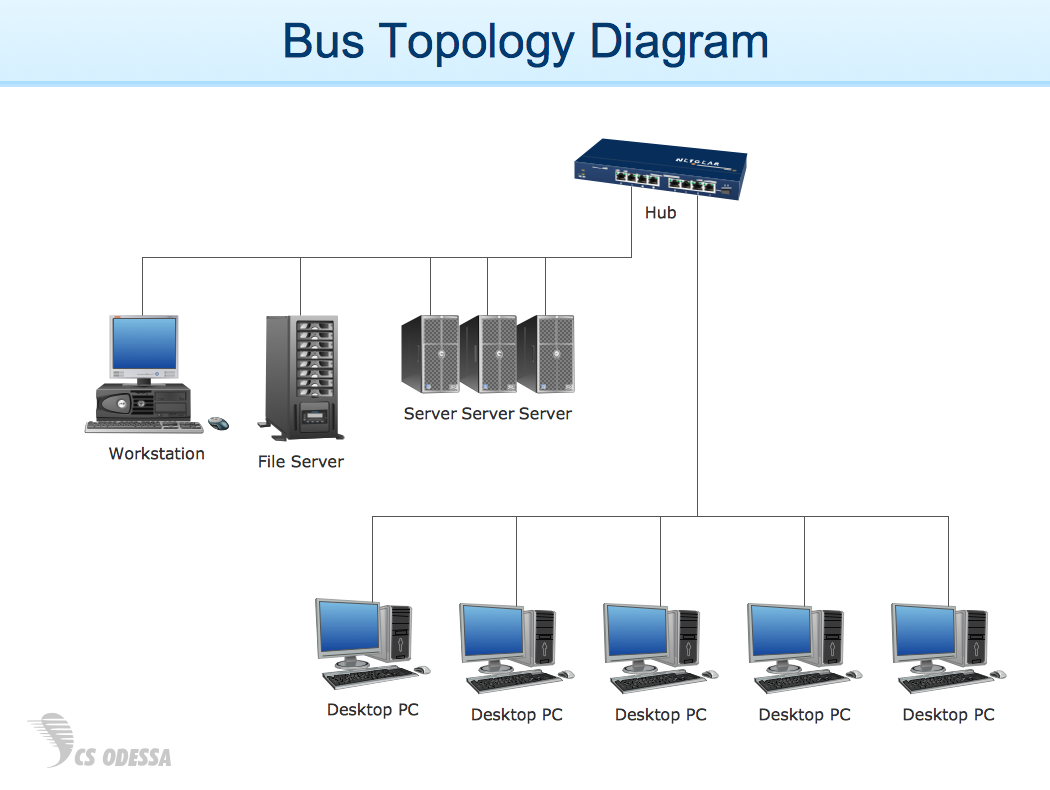
Network diagram is a chart which represents nodes and connections between them in computer network or any telecommunication network, it is a visual depiction of network architecture, physical or logical network topology. There are used common icons for the Network diagrams design, such as icons of various network appliances, computer devices, routers, clouds, peripheral devices, digital devices, etc. Network diagrams can represent networks of different scales (LAN level, WAN level) and detailization. ConceptDraw DIAGRAM diagramming software enhanced with Computer Network Diagrams solution from Computer and Networks area includes huge collection of computer and network templates, design objects and stencils, and numerous quantity of Network diagram examples and samples, among them: Basic Computer Network Diagrams, Communication Network Diagram, Wireless Router Network Diagram, LAN Topology Diagram, Computer Network System Design Diagram, Mobile Satellite Communication Network, Web-based Network Diagram, Hybrid Network Diagram, and many others.
- PERT Chart | Activity Network Diagram Method | Critical Path ...
- Fishbone Diagram Problem Solving | Network Diagram Software ...
- Or Network Diagrams Example Problems Pdf
- PERT Chart | Activity Network Diagram Method | Critical Path ...
- Root cause analysis tree diagram - Personal problem solution
- Entity Relationship Diagram Examples | Local area network (LAN ...
- Root cause analysis tree diagram - Personal problem solution ...
- PERT Chart | SWOT Analysis | Activity Network Diagram Method ...
- Venn Diagram Examples for Problem Solving. Computer Science ...
- Pert Problems And Solutions
- Hierarchical Network Topology | Venn Diagram Examples for ...
- Project Network Diagram Practice Problems
- The Solution Of Solved Problem For Block Diagrams
- Fault Tree Analysis Diagrams | PROBLEM ANALYSIS. Root Cause ...
- How to Draw a Computer Network Diagrams | Venn Diagram ...
- Cpm Pert Chart Problems With Solutions
- Network Diagram Examples | Network Diagram Software (PRO ...
- Computer Network Diagrams | Network Layout | Network Layout ...
- Process Flowchart | Fishbone Diagram Problem Solving | Activity ...
