This site uses cookies. By continuing to browse the ConceptDraw site you are agreeing to our Use of Site Cookies.

Flow Chart Symbols

The Flowcharts are incredibly useful and popular tool used in science, business, software development, analytics, engineering, marketing, manufacturing, administration, architecture, government, politics, and many other fields thanks to a variety of existing types of flowcharts. A Flowchart is a visual graphical representation of the process, algorithm, or the set of steps taken for problem's solution. Widely used for designing, visualizing and documenting simple and complex processes and programs, they effectively help to understand the process and to find easier the flaws if they are. Each flowchart type supposes the use of its own set of notations for drawing corresponding diagram, which includes the symbols of process, decision, data, document, data base, termination, initiation processes, processing loops, conditions, etc. It is easily design a Flowchart using the special professional flowchart maker - ConceptDraw DIAGRAM diagram software with numerous predesigned flow chart symbols grouped in libraries of Flowcharts solution from ConceptDraw Solution Park.

ERD Symbols and Meanings

Entity Relationship Diagram (ERD) is a popular software engineering tool for database modeling and illustration the logical structure of databases, which uses one of two notations - Chen's or Crow’s Foot. Crow's foot notation is effective when used in software engineering, information engineering, structured systems analysis and design. Each of these notations applies its own set of ERD symbols. Crow's foot diagrams use boxes to represent entities and lines between these boxes to show relationships. Varied shapes at the ends of lines depict the cardinality of a given relationship. Chen's ERD notation is more detailed way to represent entities and relationships. ConceptDraw DIAGRAM application enhanced with all-inclusive Entity-Relationship Diagram (ERD) solution allows design professional ER diagrams with Chen's or Crow’s Foot notation on your choice. It contains the full set of ready-to-use standardized ERD symbols and meanings helpful for quickly drawing, collection of predesigned ERD samples, examples and templates. ConceptDraw Pro is a great alternative to Visio for Mac users as it offers more features and can easily handle the most demanding professional needs.
How to Build an Entity Relationship Diagram (ERD)

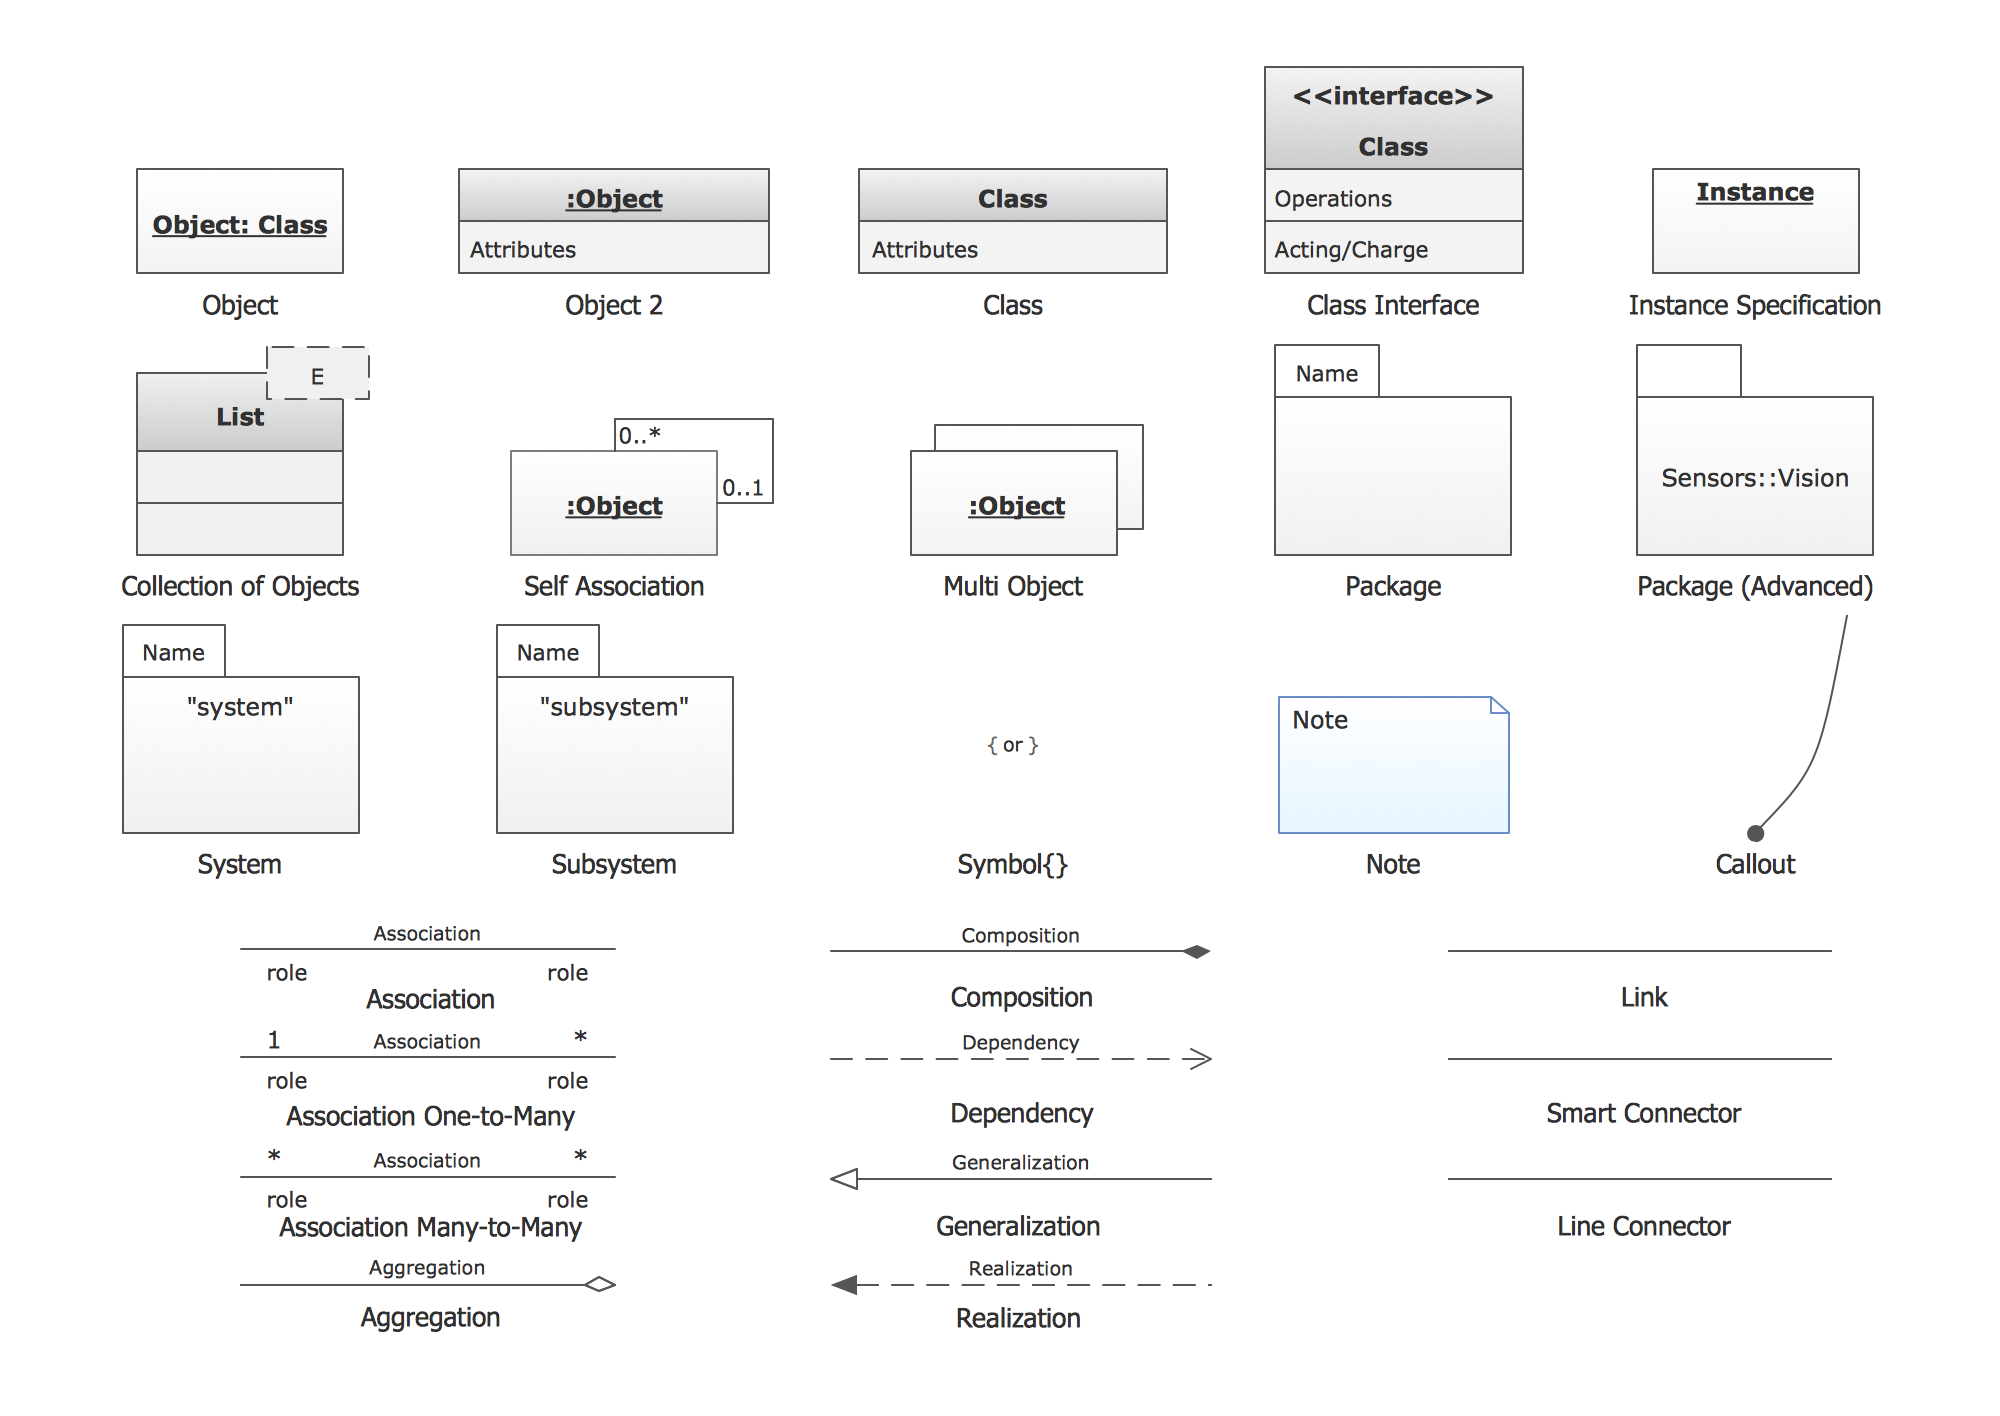
UML Object Diagram. Design Elements

UML Object Diagram shows the structure of a modeled system at a specific time. ConceptDraw has 393 vector stencils in the 13 libraries that helps you to start using software for designing your own UML Diagrams. You can use the appropriate stencils of UML notation from UML Object library.

Six Markets Model Chart

This sample shows the Six Markets Model Chart. It was created in ConceptDraw DIAGRAM diagramming and vector drawing software using the Marketing Diagrams Solution from the Marketing area of ConceptDraw Solution Park. The six markets model defines six markets that take the central place in the relationship marketing: internal markets, supplier markets, recruitment markets, referral markets, influence markets and customer markets. The six markets model allows the organization to analyze the stakeholders and key market domains that can be important to it. This model used in marketing project management software for small business project management.

How to Build Cloud Computing Diagram Principal Cloud Manufacturing

The term “cloud” is very popular and widely used now, it is a server, data processing centre, or a network which lets to store the data and software, provides access to them, allows to run applications without installation and gives the possibility to process data hosted remotely via the Internet connection. For documenting the Cloud Computing Architecture with a goal to facilitate the communication between stakeholders are successfully used the Cloud Computing Architecture diagrams. It is convenient and easy to draw various Cloud Computing Architecture diagrams in ConceptDraw DIAGRAM software with help of tools of the Cloud Computing Diagrams Solution from the Computer and Networks Area of ConceptDraw Solution Park.

How To Create a FlowChart using ConceptDraw

Have you ever needed a flowchart, but did not have the time or tools to build one? Rapid Draw allows you to build a professional flowchart quickly and easily. You have the ability to add your own shapes to Rapid Draw’s built in shape library.
HelpDesk

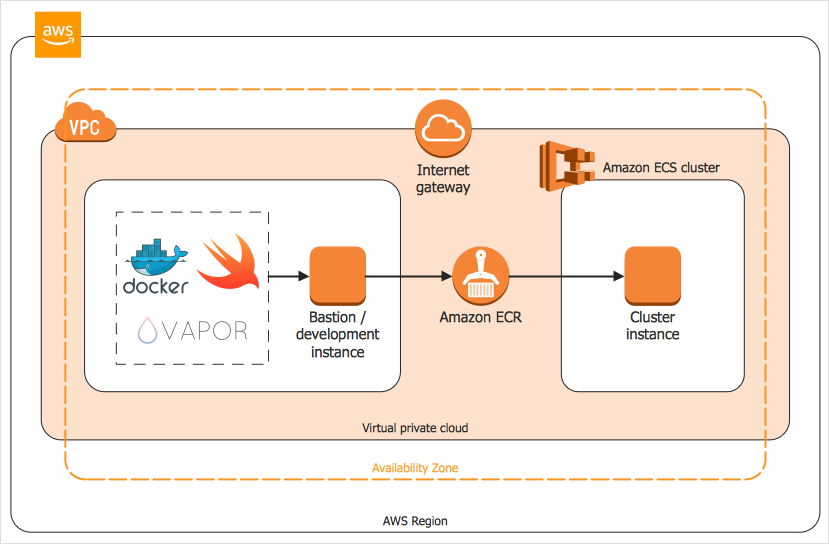
How to Create an AWS Architecture Diagram

Displaying an Amazon Web Service (AWS) cloud actually requires large amounts of attention to detail. Every element of technology has to be addressed: software, middle ware, transaction processing, scaling, data storage; the complete list is staggering. Using the ConceptDraw AWS Architecture Diagrams solution makes much easier the work on documenting the Amazon Web Service architecture. The ConceptDraw AWS Architecture Diagrams solution includes icons, sample and templates for some Amazon Web Services products and resources, to be used when buiding architecture diagrams. The icons are simple so that user can easily incorporate them in his drawings. AWS Architecture Diagrams can be used in presentations, datasheets, or any other technical visualizations.

UML Notation

Unified Modeling Language (UML) is an open standard, the language of graphic description used for modeling objects in a field of software development and software engineering. It was created for definition, specification, visualization, designing and documenting software systems, as a unification of three object-oriented technologies Booch, OMT and OOSE, and uses the defined graphic notation for creating the visual models of object-oriented software systems. Description of UML consists of two parts, interactive and supplementing each other: UML semantics, which represents a certain metamodel, defines the abstract syntax and semantics of terms of object modeling with UML, and UML notation that is a graphic notation for visual representation of UML semantics. The powerful tools of the Rapid UML solution included to ConceptDraw Solution Park make the ConceptDraw DIAGRAM diagramming and vector drawing software the best for easy applying the UML notation when creating the visual models of object-oriented software systems and designing different kinds of UML diagrams.