This site uses cookies. By continuing to browse the ConceptDraw site you are agreeing to our Use of Site Cookies.

Fully Connected Network Topology Diagram

The Fully Connected Network Topology Diagram examples was created using ConceptDraw DIAGRAM software with Computer and Networks solution.
The Computer and Networks solution from Computer and Networks area of ConceptDraw Solution Park provides examples, templates and vector stencils library with symbols of local area network (LAN) and wireless LAN (WLAN) equipment.

Point to Point Network Topology

This sample was created in ConceptDraw DIAGRAM diagramming and vector drawing software using the Computer and Networks solution from Computer and Networks area of ConceptDraw Solution Park.
This sample shows the Point-to-point network topology.
Network topology is the topological structure of the computer network.
Point-to-point network topology is a simple topology that displays the network of exactly two hosts (computers, servers, switches or routers) connected with a cable. Point-to-point topology is widely used in the computer networking and computer architecture.

Computer Network. Computer and Network Examples

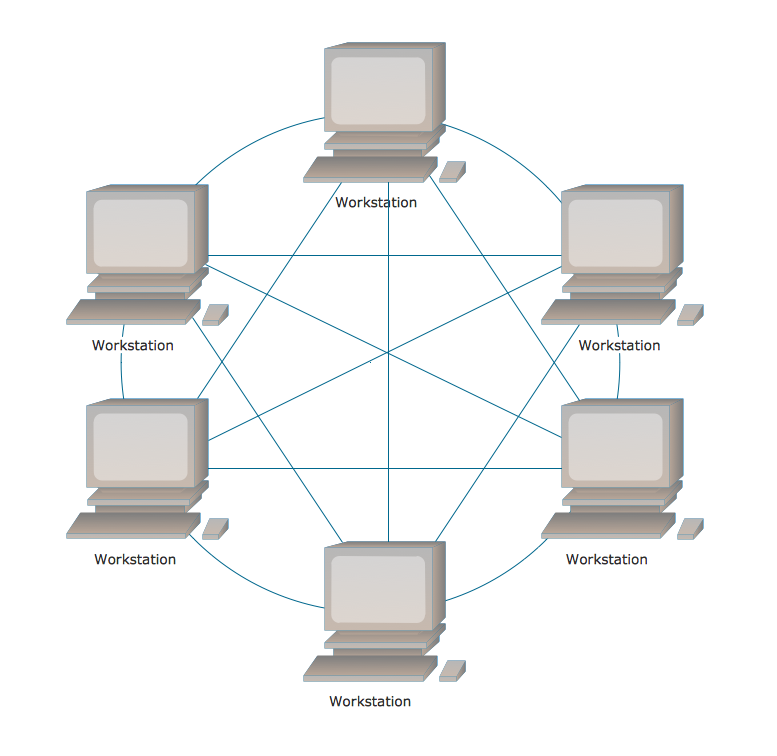
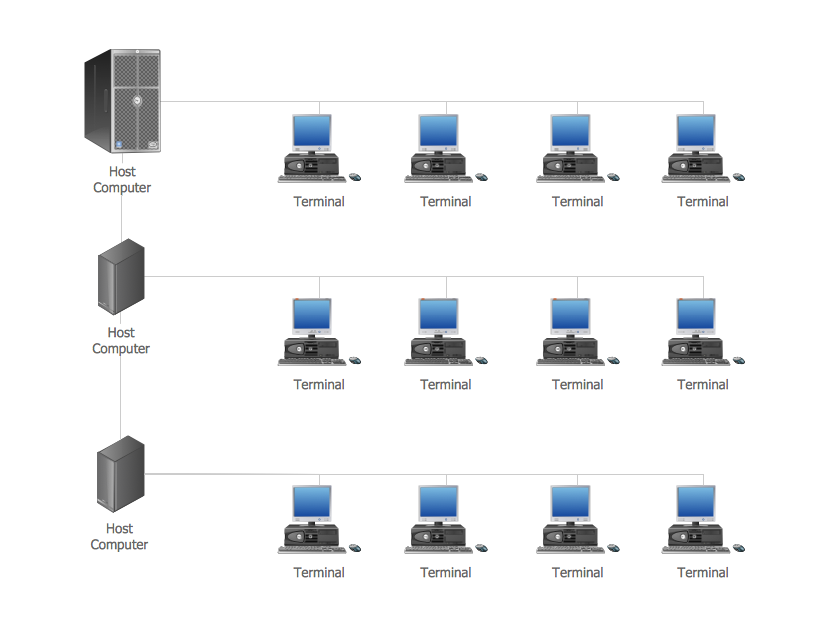
A Computer Network is a telecommunication network that allows the networked computing devices to exchange the data using the network links. The most known computer network is the Internet.
This computer network example was created in ConceptDraw DIAGRAM using the Computer and Networks Area of ConceptDraw Solution Park.

Network diagrams with ConceptDraw DIAGRAM

Network diagram is the tool for description, study and analysis of network knots and connections between these knots. Created network diagram can present you the existing information in comprehensible graphic view.
Network diagrams are divided into Physical Network Diagrams and Logical Network Diagrams.
Network diagram is an indispensable tool for network administrators and engineers at development of new networks and management of existing networks.

ERD Symbols and Meanings

Crow's foot notation is used in Barker's Notation, Structured Systems Analysis and Design Method (SSADM) and information engineering. Crow's foot diagrams represent entities as boxes, and relationships as lines between the boxes. Different shapes at the ends of these lines represent the cardinality of the relationship.
The Chen's ERD notation is still used and is considered to present a more detailed way of representing entities and relationships.
To create an ERD, software engineers mainly turn to dedicated drawing software, which contain the full notation resources for their specific database design - ERD symbols and meanings. CS Odessa has released an all-inclusive Entity-Relationship Diagram (ERD) solution for their powerful drawing program, ConceptDraw DIAGRAM.
How to Build an Entity Relationship Diagram (ERD)

SDL Flowchart Symbols

Drawing the diagrams we try to find in help the powerful software and now we have the ConceptDraw DIAGRAM. The ability easily create the SDL diagrams is made possible thanks to unique Specification and Description Language (SDL) Solution from the Industrial Engineering Area of ConceptDraw Solution Park. This solution extends ConceptDraw DIAGRAM 2 libraries - SDL Connectors and SDL Diagrams that contain 70 predesigned SDL flowchart symbols.

Geo Map - Africa - Kenya

Kenya, officially the Republic of Kenya, is a sovereign state in the African Great Lakes region of East Africa.
The vector stencils library Kenya contains contours for ConceptDraw DIAGRAM diagramming and vector drawing software. This library is contained in the Continent Maps solution from Maps area of ConceptDraw Solution Park.

Concept Map

A concept map is a way of representing relationships between ideas, images, or words.
How to draw a Concept Map quick, easy and effective? ConceptDraw DIAGRAM offers the unique Concept Maps Solution from the "Diagrams" Area that will help you!