Activity on Node Network Diagramming Tool
Activity on Node Network Diagramming Tool — Activity Network and Project Evaluation and Review Technique, or PERT, charts are a way of documenting and analyzing the tasks in a project. This sample shows the Activity on node network diagramming method. It was created in ConceptDraw DIAGRAM diagramming and vector drawing software using the Seven Management and Planning Tools solution from the Management area of ConceptDraw Solution Park.Influence Diagram
This sample shows the Influence Diagram. It was created in ConceptDraw DIAGRAM diagramming and vector drawing software using the Basic Diagramming Solution from the Universal Diagramming area of ConceptDraw Solution Park. Influence diagram represents the directed acyclic graph with three types of nodes and three types of arcs that connect the nodes. Decision node is drawn as a rectangle, Uncertainty node is drawn as an oval, Value node is drawn as an octagon.Program Evaluation and Review Technique (PERT) with ConceptDraw DIAGRAM
Program Evaluation and Review Technique (abbr. PERT) is a method developed by Ministry of Defense of the USA in 1958 for the project of creation the missile system Polaris. PERT diagram is one of the tools for project management that lets greatly simplify the planning and scheduling of large and complex projects. PERT diagram provides evaluation of project run-time and labor forces, it helps to analyze the time necessary for execution each of project tasks and the whole project, and to calculate the project critical path. PERT chart depicts the set of tasks connected each other in order of their execution and is constructed according to one of definite rules - AOA (activity on arrow) or AON (activity on node). It doesn't give you ready concrete decisions, but helps to find them. Design easy the PERT diagrams in ConceptDraw DIAGRAM software enhanced with Seven Management and Planning Tools solution from Management area of ConceptDraw Solution Park. You have a possibility to build the PERT chart of any type, but AON variant is easier for building and perception.How to Discover Critical Path on a Gantt Chart
ConceptDraw PROJECT is the Gantt chart software that implements critical path method to provide the user with a wide set of project management tools.Star Network Topology
Star is a basic computer network topology in which all nodes (computers and peripheral devices) of the network are connected to the central hub or switch with a point-to-point connection, forming a physical network segment. Such network segment can function separately or as a part of complex network topology. The switch is a server, the peripherals are the clients. The large workload and functions of network management are entrusted on the central computer, all information exchange goes through it, so it must to be obligatory the most powerful. The star network topology is a simple topology for design and implementation. Its advantages are high performance, flexible administration capabilities, simplicity of adding additional nodes and search of faults, the fact that a failure of one workstation doesn't affect the work of entire network. But the failure of central hub will result the failure of whole network or network segment - it's the main disadvantage. Use the ConceptDraw DIAGRAM with Computer and Networks solution to designing Star Network Topology Diagrams fast and easy.
How To Use Collaboration Tool in Project Management
Collaboration tool for project management enables you to give a new role to knowledge management and document sharing within your team.
How to Create Presentation of Your Project Gantt Chart
During the planning, discussing and execution of a project you may need to prepare a presentation using project views such as the Gantt Chart, Multiproject Dashboard or Resource Usage View. It’s easy do with ConceptDraw PROJECT!ConceptDraw Arrows10 Technology
Connecting objects manually in ConceptDraw DIAGRAM is a snap: - points; - Connecting groups of objects; - Auto-routing; - Connectors text; - Snap to Guides ; - Quick.Hotel Network Topology Diagram
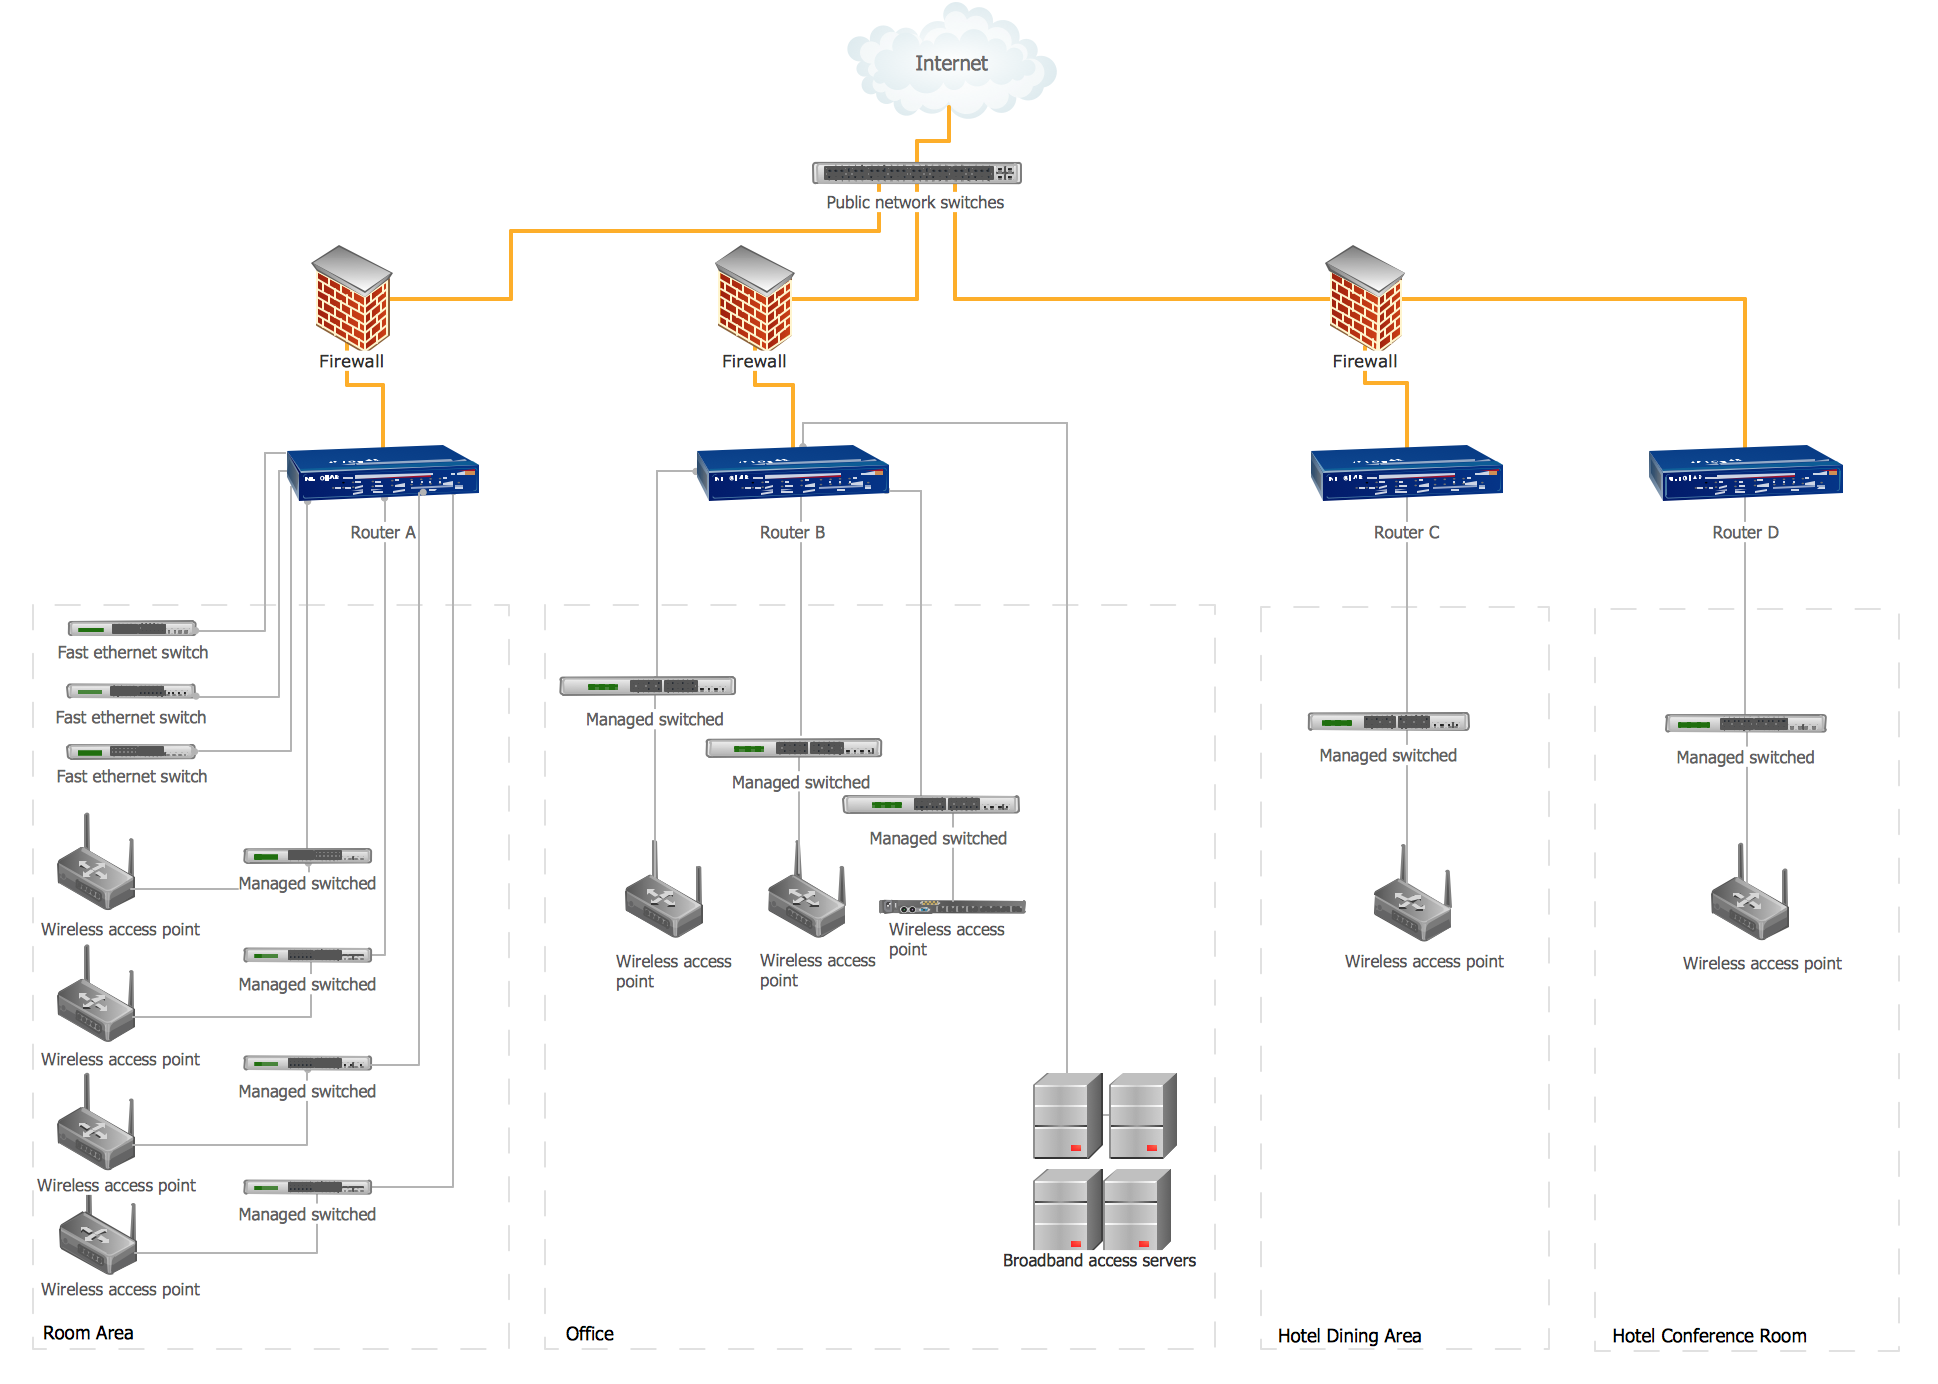
Network topology is a layout of various elements of computer network, such as nodes, links, routers, etc. It is a network topological structure which can be depicted logically or physically. Physical topology shows the physical location of network's components and cable connections between network nodes. Logical topology describes the data flows, the circulation of signals in physical topology. The physical and logical topologies for two networks can be identical, while their physical interconnections, the distances between nodes, transmission rates, and/or signal types may be differ. ConceptDraw DIAGRAM with Computer and Networks solution from Computer and Networks area of ConceptDraw Solution Park lets you design physical and logical network topology diagrams for wireless and wired computer communication networks located in various premises, including the hotels. You can easy design Hotel Network Topology Diagram, diagrams depicted LANs and WLANs, and also any of eight basic topologies (Point-to-point, Star, Bus, Mesh, Ring, Tree, Hybrid, Daisy chain).
Types of Flowcharts
A Flowchart is a graphical representation of process, algorithm, workflow or step-by-step solution of the problem. It shows the steps as boxes of various kinds and connects them by arrows in a defined order depicting a flow. There are twelve main Flowchart types: Basic Flowchart, Business Process Modeling Diagram (BPMN), Cross Functional Flowchart, Data Flow Diagram (DFD), IDEF (Integrated DEFinition) Flowchart, Event-driven Process Chain (EPC) Diagram, Influence Diagram (ID), Swimlane Flowchart, Process Flow Diagram (PFD), Specification and Description Language (SDL) Diagram, Value Stream Mapping, Workflow Diagram. Using the Flowcharts solution from the Diagrams area of ConceptDraw Solution Park you can easy and quickly design a Flowchart of any of these types. This solution offers a lot of special predesigned vector symbols for each of these widely used notations. They will make the drawing process of Flowcharts much easier than ever. Pay also attention for the included collection of ready Flowchart examples, samples and quick-start templates. This is business process improvement tools. If you are looking for MS Visio for your Mac, then you are out of luck, because it hasn't been released yet. However, you can use Visio alternatives that can successfully replace its functions. ConceptDraw DIAGRAM is an alternative to MS Visio for Mac that provides powerful features and intuitive user interface for the same.
- Activity Diagram For Project Management System
- What Is Activity Diagram In Project Management
- Project Management Net Work Diagram Activity On Node
- PERT chart - Template | Activity On Node Diagram Template
- Activities In A Project Management Software With Example Diagram
- A Task Network Diagram In Soft Project Management
- Project Management Network Diagram Software Free
- Draw Project Management Nodes
- PERT chart - Project management plan | Project — Working With ...
- Activity On Node Diagrams For Project Management On Pdf Format


