"A food bank or foodbank is a non-profit, charitable organization that distributes food to those who have difficulty purchasing enough food to avoid hunger.
In the United States and Australia, food banks usually operate on the "warehouse" model. They act as food storage and distribution depots for smaller front line agencies; and usually do not themselves give out food directly to the hungry. After the food is collected, sorted, and reviewed for quality, these food banks distribute it to non-profit community or government agencies, including food pantries, food closets, soup kitchens, homeless shelters, orphanages, and schools.
Outside North America and Australia, the "front line" model is often found. Such food banks give out most or all of their food directly to the end users. For both models, the largest sources of food include for-profit growers, manufacturers, distributors and retailers who in the normal course of business have excess food that they cannot sell. Some foodbanks receive a substantial proportion of their food from individual donors, including their volunteer workers. There is considerable overlap with food salvage, food rescue and gleaning, although not with freeganism or dumpster-diving." [Food bank. Wikipedia]
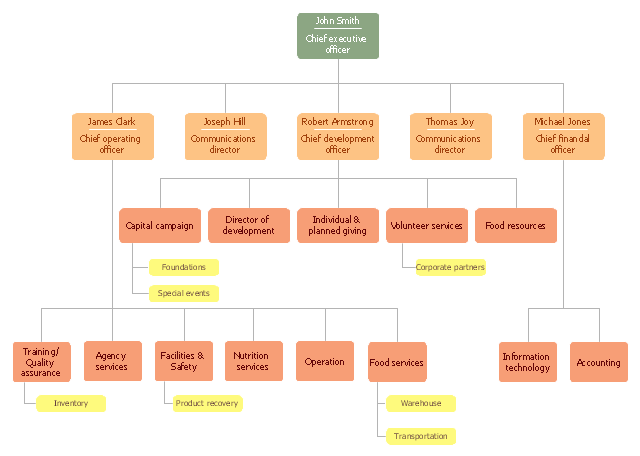
The organization chart example "Foodbank" was created using the ConceptDraw PRO diagramming and vector drawing software extended with the Organizational Charts solution from the Management area of ConceptDraw Solution Park.
Organizational Chart Templates
ConceptDraw offers you a number of ready-made organizational chart templates which you can use in your drawing. They are grouped in topical sets as organizational chart template files. Use the Organizational Charts Solution for ConceptDraw DIAGRAM to create your own Organizational Charts of any complexity quick, easy and effective. The Organizational Charts designed with ConceptDraw DIAGRAM are vector graphic documents and are available for reviewing, modifying, converting to a variety of formats (image, HTML, PDF file, MS PowerPoint Presentation, Adobe Flash or MS Visio XML), printing and send via e-mail in one moment.
Stakeholder Onion Diagrams
The Stakeholder Onion Diagram is a popular and widely used way to view the relationships of stakeholders to a project goal. The Onion Diagram focuses on the project goal, most of other diagram styles focus on the project, stakeholders, and timeline. This difference favorably distinguishes and separates the Onion Diagram from other types of diagrams. Design fast and easy Stakeholder Onion Diagrams of any complexity in ConceptDraw DIAGRAM diagramming and vector drawing software using the powerful tools of Stakeholder Onion Diagrams Solution from the Management Area of ConceptDraw Solution Park.Fundraising Pyramid
ConceptDraw Pyramid Diagram software allows drawing column charts using predesigned objects or drawing tool.Business Diagram Software
When managing the projects, people, or networks, there are daily designed and used different types of Business diagrams, so the powerful drawing software will be very useful for this. ConceptDraw DIAGRAM with large quantity of business solutions will meet your needs and will help you convey your ideas successful and rapidly, no matter are you professional or beginner. It is the best choice for business specialists and technical professionals who need quickly and easily explore, visualize, and communicate information. ConceptDraw DIAGRAM business diagram software is the most powerful business software and relational charting software. Create advanced, completely customizable Business Process Diagrams, Business Flow Charts, Work Flow Diagrams, Organizational Charts, Audit diagrams, Marketing diagrams, Value Stream Maps, TQM diagrams, ERD diagrams, EPC diagrams, Cause and Effect diagrams, Infographics, Dashboards, and other Relational business diagrams from your data using the powerful drawing tools of ConceptDraw Solution Park.
Competitor Analysis
Competitor analysis is a first and obligatory step in elaboration the proper corporate marketing strategy and creating sustainable competitive advantage. Use powerful opportunities of numerous solutions from ConceptDraw Solution Park for designing illustrative diagrams, charts, matrices which are necessary for effective competitor analysis.Venn Diagram Examples for Problem Solving
Venn diagrams are illustrations used in the branch of mathematics known as set theory. They show the mathematical or logical relationship between different groups of things (sets). A Venn diagram shows all the possible logical relations between the sets.SWOT Matrix Software
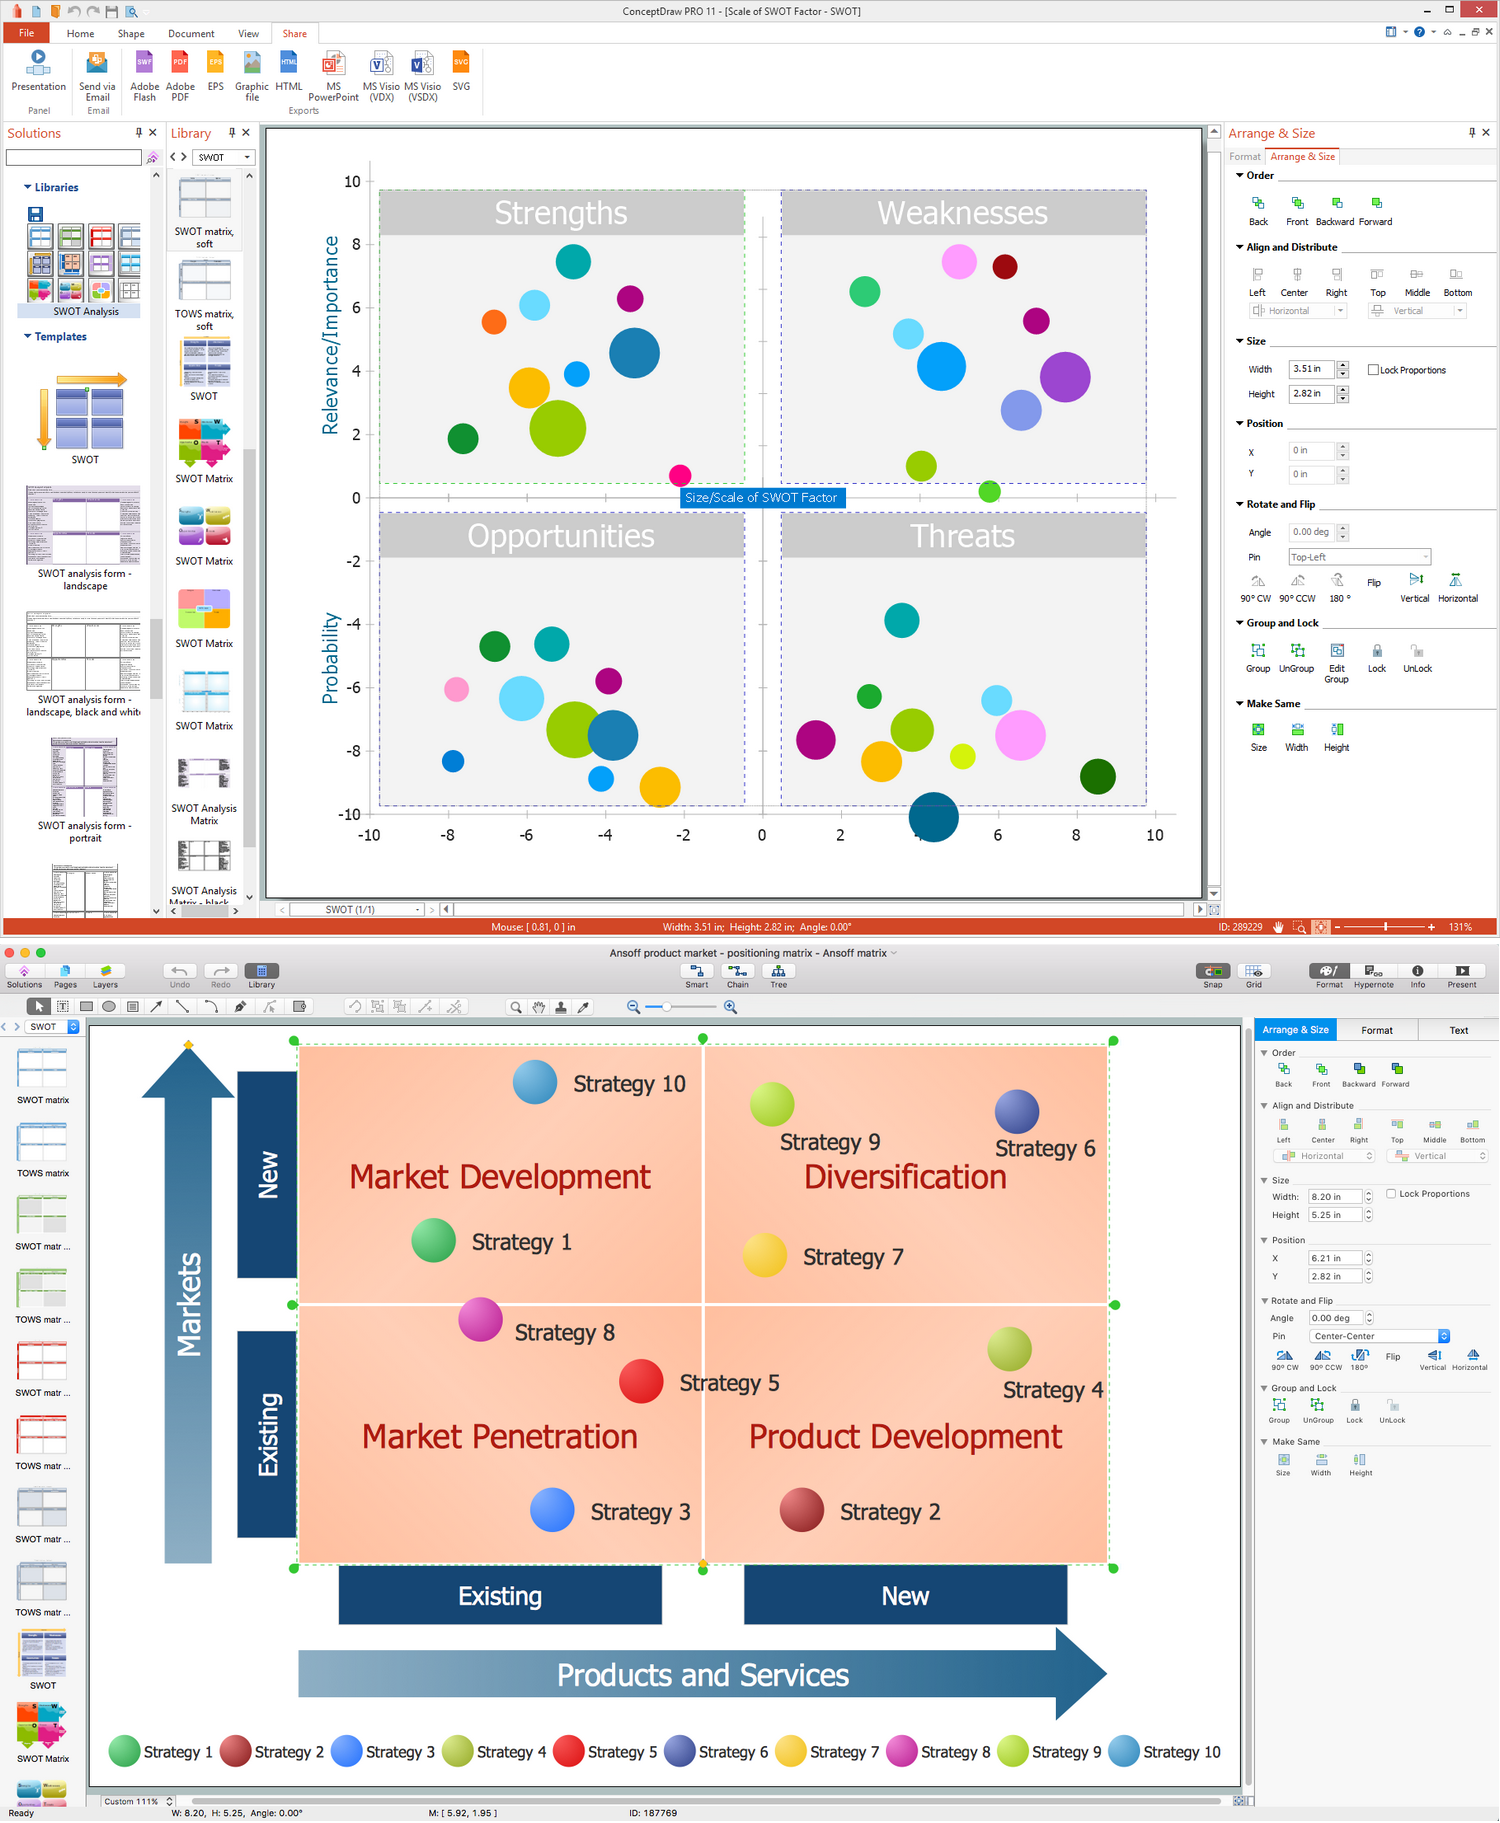
The SWOT Analysis solution from the Management area of ConceptDraw Solution Park contains set of examples, templates and vector design elements of SWOT and TOWS matrices. It helps you to quickly draw SWOT and TOWS analysis matrix diagrams using the best SWOT matrix software ConceptDraw DIAGRAM.Looking at ConceptDraw MINDMAP as a Replacement for Mindjet Mindmanager
The comparing of ConceptDraw MINDMAP to Mindjet Mindmanager allows to identify a lot of benefits. At first, the ConceptDraw MINDMAP has a lower price, the flexible licensing, the license is per-named-user, no charge for major product upgrades and no charge for support. ConceptDraw MINDMAP is effective for launching the stalled projects to new heights, it possess the excellent possibility of importing and exporting to other mind mapping program file formats. ConceptDraw MINDMAP easily integrates with wide set of programs, among them Evernote, Skype, Twitter, Microsoft Word, Microsoft PowerPoint, Microsoft Project, Mindjet Mindmanager, ConceptDraw PROJECT, ConceptDraw DIAGRAM , with solutions from ConceptDraw Solution Park. Now you have a freedom to choose the best format for each your document, it is incredibly easy to make the Skype presentation, to take and share critical information, to send your Mind Map to Evernote, to import / export MS Word documents, MS PowerPoint presentations, the project data, open and save Mindmanager files, to map out the long-term Twitter messages and publish them to your Twitter account directly from a Mind Map.Line Chart Template for Word
This sample was created in ConceptDraw DIAGRAM diagramming and vector drawing software using the Line Graphs Solution from Graphs and Charts area of ConceptDraw Solution Park. This sample shows the Line Chart of annual percentage change. The Line Chart allows you to clearly see the changes of data over the time.- Organization chart - Foodbank | Non Profit Organization Structure ...
- Sample Or Non Profit Food Bank Organizational Structure Chart
- How to Purchase ConceptDraw Products for Academic/ Nonprofit ...
- Organizational Flow Chart For Non Profit
- Non Hierarchical Organizational Chart
- Organizational Chart For Food Business
- Business diagrams & Org Charts with ConceptDraw PRO ...
- Organizational Structure | How to Draw an Organization Chart ...
- School and Training Plans | Organizational Charts | Cross ...


