 Business Process Diagrams
Business Process Diagrams solution extends the ConceptDraw DIAGRAM BPM software with RapidDraw interface, templates, samples and numerous libraries based on the BPMN 1.2 and BPMN 2.0 standards, which give you the possibility to visualize equally easy simple and complex processes, to design business models, to quickly develop and document in details any business processes on the stages of project’s planning and implementation.
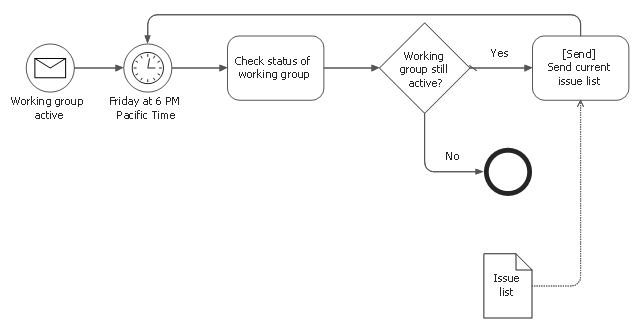
This BPMN diagram sample was designed on the base of the Wikimedia Commons file: BPMN-AProcesswithNormalFlow.svg. [commons.wikimedia.org/ wiki/ File:BPMN-AProcesswithNormalFlow.svg]
"Business process modelling (BPM) is the activity of representing processes of an enterprise, so that the current ("as is") process may be analyzed and improved in future ("to be"). Business process modelling is typically performed by business analysts and managers who are seeking to improve process efficiency and quality. The process improvements identified by business process modelling may or may not require Information Technology involvement, although that is a common driver for the need to model a business process, by creating a process master.
Change management programs are typically involved to put the improved business processes into practice. With advances in technology from large platform vendors, the vision of business process modelling models becoming fully executable (and capable of simulations and round-trip engineering) is coming closer to reality every day." [Enterprise modelling. Wikipedia]
The business process diagram example "A process with normal flow" was created using the ConceptDraw PRO diagramming and vector drawing software extended with the Business Process Model and Notation solution from the Business Processes area of ConceptDraw Solution Park.
Active Directory
The Active Directory Diagrams solution from ConceptDraw Solution Park extends ConceptDraw DIAGRAM diagramming and vector drawing software to help network engineers, designers and administrators efficiently design and create various active directory diagrams.
 Marketing Diagrams
Marketing Diagrams solution extends ConceptDraw DIAGRAM diagramming software with abundance of samples, templates and vector design elements intended for easy graphical visualization and drawing different types of Marketing diagrams and graphs, including Branding Strategies Diagram, Five Forces Model Diagram, Decision Tree Diagram, Puzzle Diagram, Step Diagram, Process Chart, Strategy Map, Funnel Diagram, Value Chain Diagram, Ladder of Customer Loyalty Diagram, Leaky Bucket Diagram, Promotional Mix Diagram, Service-Goods Continuum Diagram, Six Markets Model Diagram, Sources of Customer Satisfaction Diagram, etc. Analyze effectively the marketing activity of your company and apply the optimal marketing methods with ConceptDraw DIAGRAM software.
Network Diagram Software. LAN Network Diagrams. Physical Office Network Diagrams
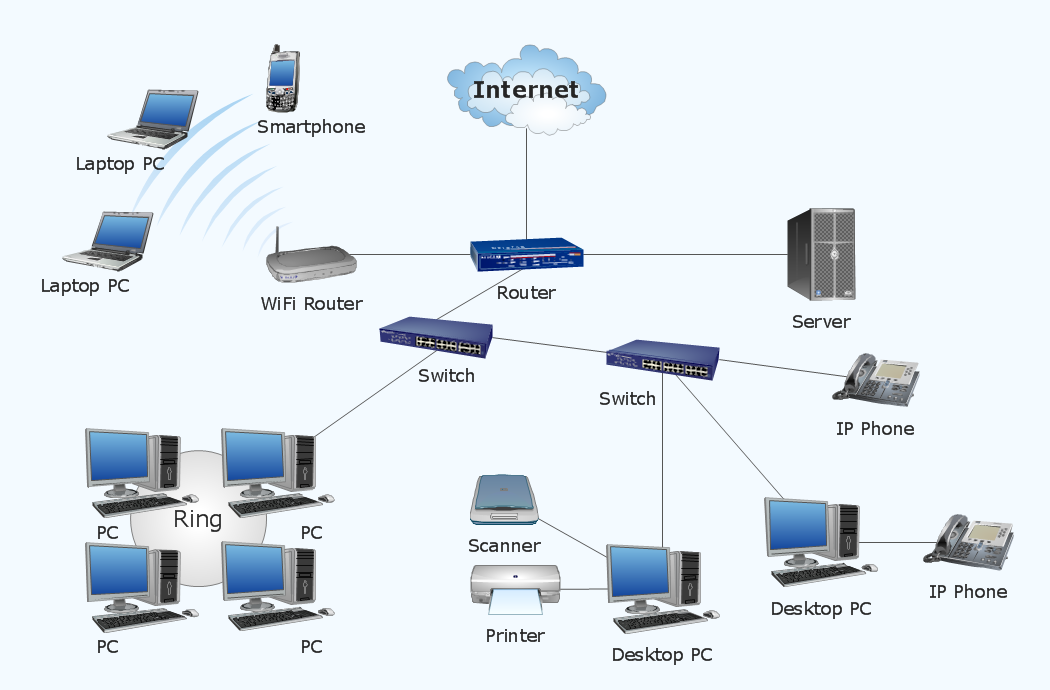
Physical LAN Diagrams illustrate the communication schemes of Local Area Networks, the physical network connection of computers and networks arrangement on the small areas - at homes, offices, and other buildings. ConceptDraw DIAGRAM is a perfect network diagramming software with samples and examples of WAN and LAN Diagrams, templates and collection of network components libraries. Computer Network Diagrams Solution for ConceptDraw DIAGRAM Mac and Windows is ideal for IT professionals, network engineers and network designers who need to visualize network architecture, to document LANs physical structure and arrangement, to draw Local Area Network (LAN) diagrams and schematics, WAN diagrams, physical office network diagrams and topologies, wiring drawings, etc. You can design all them easy using the predesigned vector objects of computers and computer network devices, hardware devices, peripheral devices, external digital devices, internet and logical symbols, and many other stencils from the Computer Network Diagrams libraries. ConceptDraw DIAGRAM offers a powerful and easy-to-use solution for those who looking for a Visio alternative for Mac. It is a world-class diagramming platform with dynamic presentation power.
Basic Flowchart Symbols and Meaning
Flowcharts are the best for visually representation the business processes and the flow of a custom-order process through various departments within an organization. ConceptDraw DIAGRAM diagramming and vector drawing software extended with Flowcharts solution offers the full set of predesigned basic flowchart symbols which are gathered at two libraries: Flowchart and Flowcharts Rapid Draw. Among them are: process, terminator, decision, data, document, display, manual loop, and many other specific symbols. The meaning for each symbol offered by ConceptDraw gives the presentation about their proposed use in professional Flowcharts for business and technical processes, software algorithms, well-developed structures of web sites, Workflow diagrams, Process flow diagram and correlation in developing on-line instructional projects or business process system. Use of ready flow chart symbols in diagrams is incredibly useful - you need simply drag desired from the libraries to your document and arrange them in required order. There are a few serious alternatives to Visio for Mac, one of them is ConceptDraw DIAGRAM. It is one of the main contender with the most similar features and capabilities.
 Business Process Model and Notation
Business Process Model and Notation Solution for ConceptDraw DIAGRAM is helpful for modeling the business processes of any degree of complexity, documenting them and effective creating diagrams using the BPMN 2.0 standard.
Basketball Court Diagram and Basketball Positions
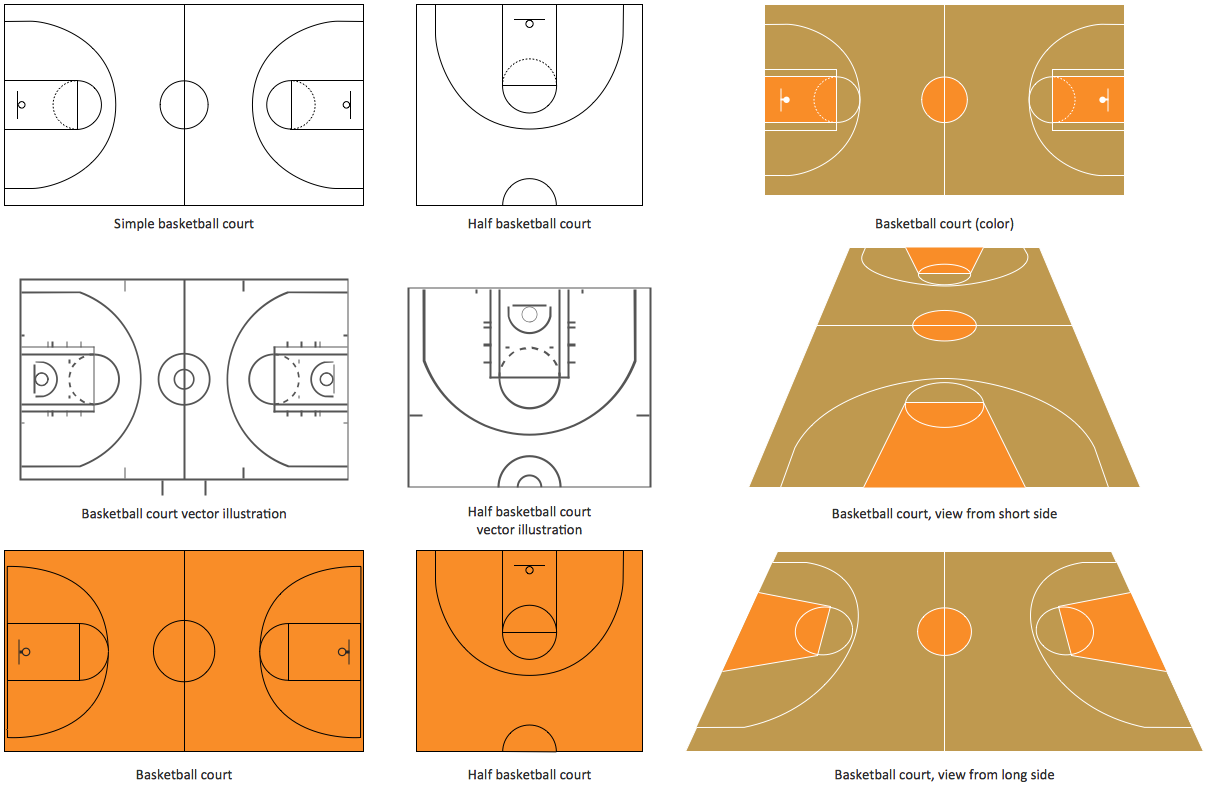
The illustration of possible situations during the basketball matches, presentation of basketball positions and the best tactics, explanation of rules and training to successful game, become much more easier and time saving with visual illustrations and drawings. Creation of several illustrations and comparing them lets effectively show the differences and advantages in positions of players. ConceptDraw DIAGRAM software extended with Basketball solution from Sport area of ConceptDraw Solution Park provides the shapes' libraries with different kinds of basketball courts and basketball positions, templates and samples, which will render great help for basketball specialists and fans in drawing professional-looking and illustrative basketball-related diagrams and schematics of any complexity in a few minutes. Extensive export capabilities of ConceptDraw DIAGRAM to varied graphical formats open before you wide field for activities and possibility to easy communicate with large quantity of people, which have different software installed on their devices.Network diagrams with ConceptDraw DIAGRAM
Network diagram is effective tool for representing and description the network knots and connections between them in comprehensible graphic view, for studying and analysis them. The network administrators and engineers actively use Physical Network Diagrams and Logical Network Diagrams, which are both indispensable when developing and documenting new networks, and managing existing ones. Network diagrams let clearly represent the network configuration and structure, used protocols, addresses, and also names of network objects. Physical Network Diagrams depict the information about telecommunications data, servers, location of network equipment and number of network users. Logical Network Diagrams describe about logical network structure. It is useful to use the ready sets of network clipart, pictures and symbols for indication the network knots on a diagram, such as developed by professionals and offered in large quantity by Computer Network Diagrams solution from ConceptDraw Solution Park.Pyramid Diagram
Zooko's triangle is a diagram named after Zooko Wilcox-O'Hearn which sets out suspected tradeoffs for a system for giving names to participants in a network protocol.- Normal distribution graph - Template | Marketing diagrams - Vector ...
- Normal Product Cycle Block Diagram
- Normal Diagram Examples
- UML Diagram | Basic Flowchart Symbols and Meaning | Normal ...
- Normal distribution graph - Template | Winter Sports | Templates ...
- Food Resources Normal Diagram
- Normal distribution graph - Template | Marketing Diagrams ...
- Marketing Diagrams | Business Process Diagrams | USA Maps ...
- Emergency Plan | Normal Kitchen Flow Diagram


