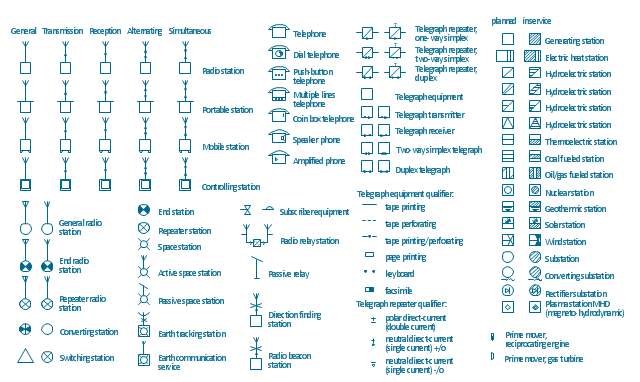
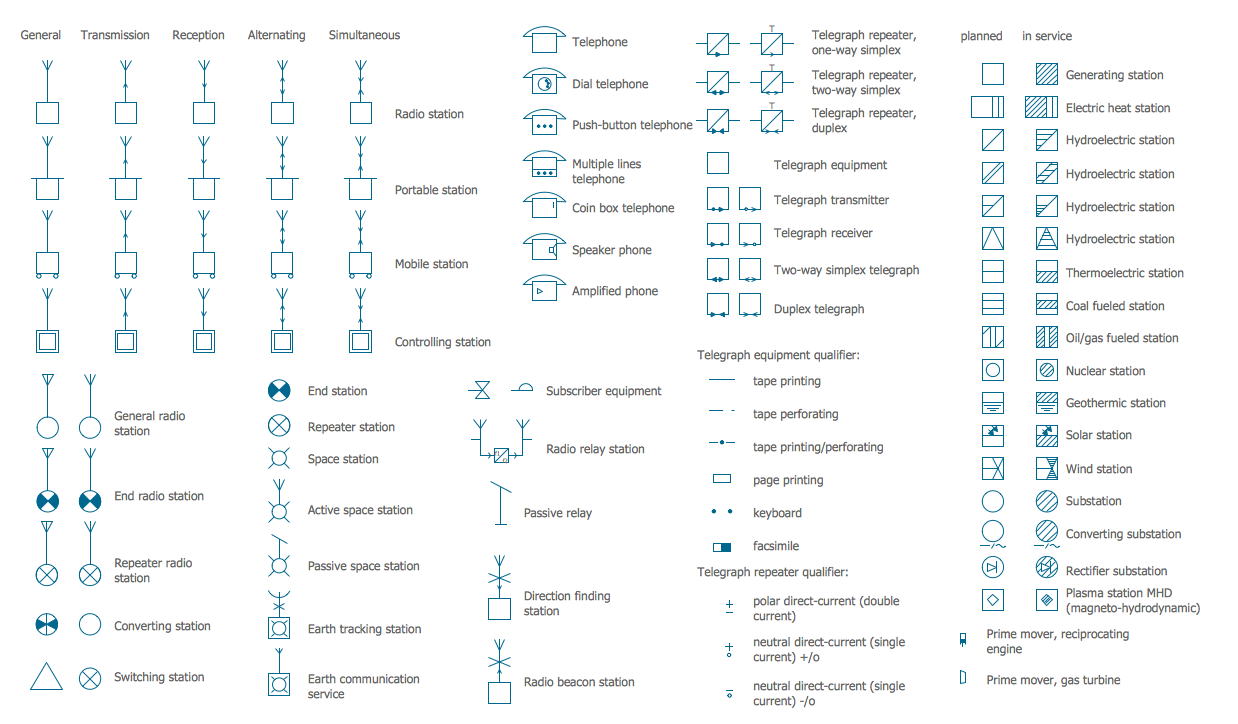
The vector stencils library "Stations" contains 110 symbols of communications equipment, generating, transmitting and receiving stations; substations; satellites; and power plants for power generation and distribution and radio relay systems.
"A power station (also referred to as a generating station, power plant, powerhouse or generating plant) is an industrial facility for the generation of electric power. At the center of nearly all power stations is a generator, a rotating machine that converts mechanical power into electrical power by creating relative motion between a magnetic field and a conductor. The energy source harnessed to turn the generator varies widely. It depends chiefly on which fuels are easily available, cheap enough and on the types of technology that the power company has access to. Most power stations in the world burn fossil fuels such as coal, oil, and natural gas to generate electricity, and some use nuclear power, but there is an increasing use of cleaner renewable sources such as solar, wind, wave and hydroelectric." [Power station. Wikipedia]
"Radio broadcasting is a one-way wireless transmission over radio waves intended to reach a wide audience. Stations can be linked in radio networks to broadcast a common radio format, either in broadcast syndication or simulcast or both. Audio broadcasting also can be done via cable radio, local wire television networks, satellite radio, and internet radio via streaming media on the Internet.
The signal types can be either analog audio or digital audio." [Radio broadcasting. Wikipedia]
The shapes example "Design elements - Stations" was drawn using the ConceptDraw PRO diagramming and vector drawing software extended with the Electrical Engineering solution from the Engineering area of ConceptDraw Solution Park.
Electrical Symbols — Stations
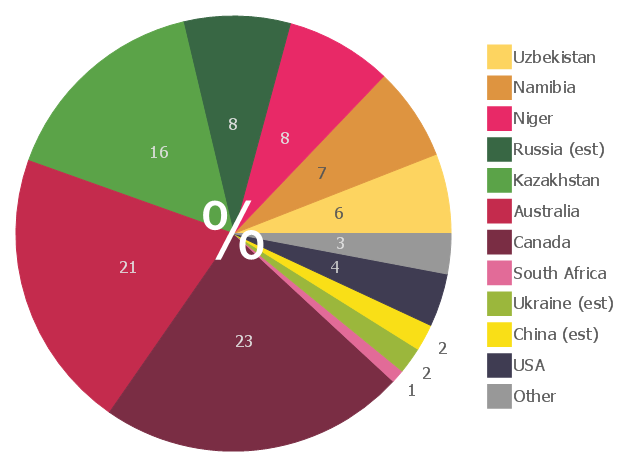
A power station is an industrial facility for the generation of electric power. Most power stations contain one or more generators, a rotating machine that converts mechanical power into electrical power. The relative motion between a magnetic field and a conductor creates an electrical current. The energy source harnessed to turn the generator varies widely. Most power stations in the world burn fossil fuels such as coal, oil, and natural gas to generate electricity. Others use nuclear power, but there is an increasing use of cleaner renewable sources such as solar, wind, wave and hydroelectric. 26 libraries of the Electrical Engineering Solution of ConceptDraw PRO make your electrical diagramming simple, efficient, and effective. You can simply and quickly drop the ready-to-use objects from libraries into your document to create the electrical diagram.This pie chart sample shows the 2007 world uranium mining by countries.
It was designed on the base of the Wikimedia Commons file: 2007Uranium.PNG.[commons.wikimedia.org/ wiki/ File:2007Uranium.PNG]
This file is licensed under the Creative Commons Attribution 3.0 Unported license. [creativecommons.org/ licenses/ by/ 3.0/ deed.en]
"Uranium mining is the process of extraction of uranium ore from the ground. The worldwide production of uranium in 2009 amounted to 50,572 tonnes. Kazakhstan, Canada, and Australia are the top three producers and together account for 63% of world uranium production. Other important uranium producing countries in excess of 1,000 tons per year are Namibia, Russia, Niger, Uzbekistan, and the United States.
Uranium ores are normally processed by grinding the ore materials to a uniform particle size and then treating the ore to extract the uranium by chemical leaching. The milling process commonly yields dry powder-form material consisting of natural uranium, "yellowcake," which is sold on the uranium market as U3O8.
A prominent use of uranium from mining is as fuel for nuclear power plants." [Uranium mining. Wikipedia]
The pie chart example "2007 World uranium mining" was created using the ConceptDraw PRO diagramming and vector drawing software extended with the Pie Charts solution of the Graphs and Charts area in ConceptDraw Solution Park.
The vector stencils library "Picture Graphs" contains 35 templates of picture bar graphs for visual data comparison and time series.
Drag a template from the library to your document, set bars number, type category labels, select bars and enter your data.
Use these shapes to draw your pictorial bar charts in the ConceptDraw PRO diagramming and vector drawing software.
The vector stencils library "Picture Graphs" is included in the Picture Graphs solution from the Graphs and Charts area of ConceptDraw Solution Park.
The vector stencils library "Ecology pictograms" contains 20 icons of eco symbols. Use it to draw your ecological infographics. The example "Ecology pictograms - Vector stencils library" was created using the ConceptDraw PRO diagramming and vector drawing software extended with the Pictorial infographics solution from the area "What is infographics" in ConceptDraw Solution Park.
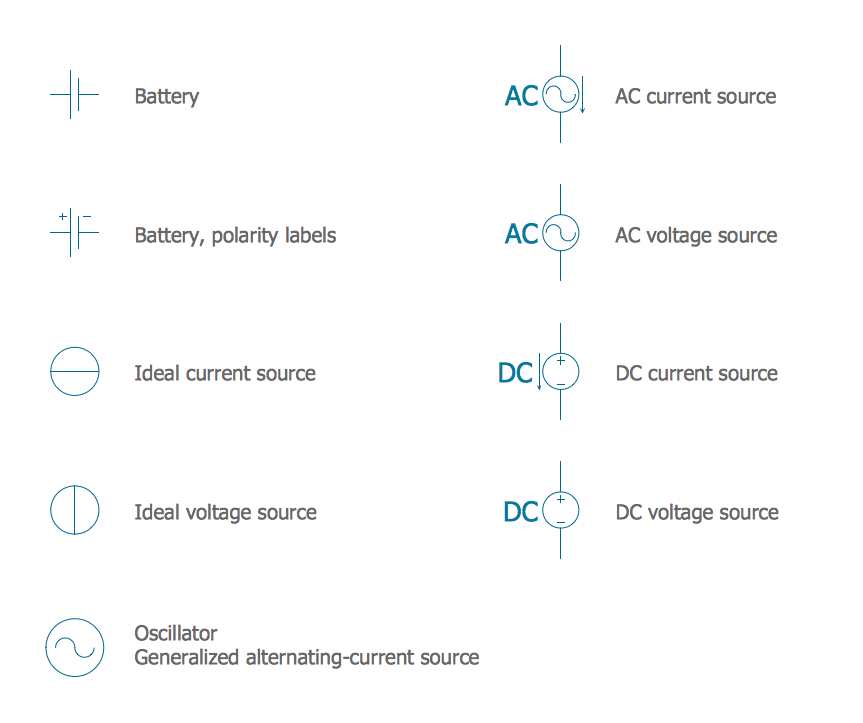
Electrical Symbols — Power Sources
A voltage source is a two terminal device which can maintain a fixed voltage. An ideal voltage source can maintain the fixed voltage independent of the load resistance or the output current. However, a real-world voltage source cannot supply unlimited current. A voltage source is the dual of a current source. Real-world sources of electrical energy, such as batteries, generators, and power systems, can be modeled for analysis purposes as a combination of an ideal voltage source and additional combinations of impedance elements. 26 libraries of the Electrical Engineering Solution of ConceptDraw PRO make your electrical diagramming simple, efficient, and effective. You can simply and quickly drop the ready-to-use objects from libraries into your document to create the electrical diagram."The United States is the 800th largest energy consumer in terms of total use in 2010. ...
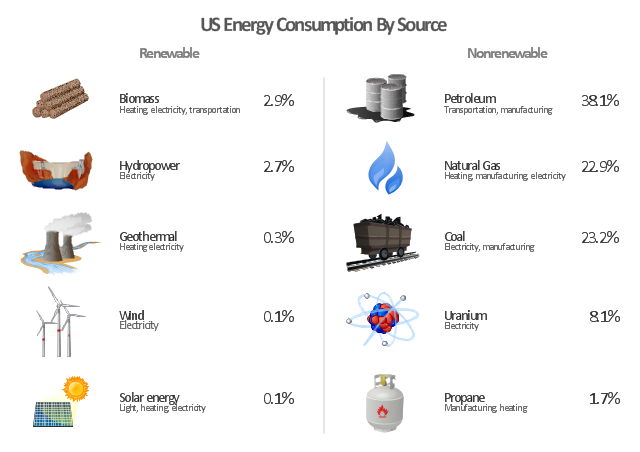
The majority of this energy is derived from fossil fuels: in 2010, data showed 25% of the nation's energy came from petroleum, 22% from coal, and 22% from natural gas. Nuclear power supplied 8.4% and renewable energy supplied 8%, which was mainly from hydroelectric dams although other renewables are included such as wind power, geothermal and solar energy." [Energy in the United States. Wikipedia]
The infographics example "U.S. energy consumption by source" was created in the ConceptDraw PRO diagramming and vector drawing software using the Manufacturing and Maintenance solution from the Illustration area of ConceptDraw Solution Park.
The vector stencils library "Ecology pictograms" contains 20 icons of eco symbols. Use it to draw your ecological infographics. The example "Ecology pictograms - Vector stencils library" was created using the ConceptDraw PRO diagramming and vector drawing software extended with the Pictorial infographics solution from the area "What is infographics" in ConceptDraw Solution Park.
 Divided Bar Diagrams
The Divided Bar Diagrams Solution extends the capabilities of ConceptDraw PRO v10 with templates, samples, and a library of vector stencils for drawing high impact and professional Divided Bar Diagrams and Graphs, Bar Diagram Math, and Stacked Graph.
- Nuclear Power Plant Symbol
- Power Plant Electrical System Drawing Symbols
- Power Plant Design
- Power Plants
- Power Plant
- Power Plant Png
- Electric Symbol Of Hydro Electric Power Plant
- Sample Drawing On Power Station
- Oil Power Plan Drawing
- Symbol For Power Plant
- Power Plant Symbols
- Power Plant Symbol Png
- Electrical Symbols, Electrical Diagram Symbols | Electrical Symbols ...
- Electrical Symbols — Power Sources | Electrical Symbols ...
- Electrical Industries Pawer Plant Drawing
- Logo Of Atomic Power Plant
- Power Plant Engineering Drawing
- Design elements - Nuclear physics | Nuclear physics - Vector ...
- Power Plant Electrical Symbols
- Power Plant Engineer Drawing
