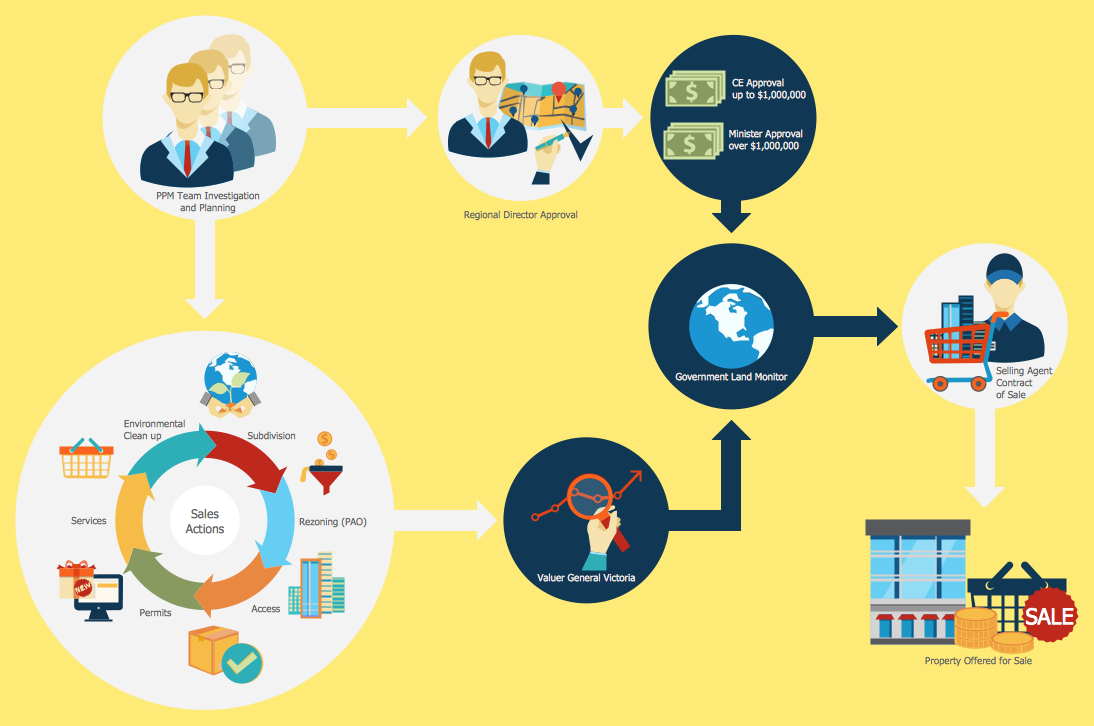
The vector stencils library "Sales workflow" contains 39 sales workflow symbols.
Use these sales icon set to draw your sales flowcharts, workflow diagrams and process charts with the ConceptDraw PRO diagramming and vector drawing software.
The sales pictograms library "Sales workflow" is included in the Sales Flowcharts solution from the Marketing area of ConceptDraw Solution Park.
Sales Steps
Helps to create professionally looking and detailed Sales Flowcharts with all sales steps visually represented on them. Use the Sales Flowcharts Solution for ConceptDraw PRO software to create your own Sales Flowcharts of any complexity quickly, easily and effectively to use them successfully in your work activity. ConceptDraw PRO diagramming and vector drawing software supplied with unique Sales Flowcharts solution from the Marketing area of ConceptDraw Solution Park allows fast and easy visualize all sales steps of the sales process on a sales process Map or sales process flowchart, and then realize them easily.Pyramid Diagram
The DIKW Pyramid refers loosely to a class of models for representing purported structural and/or functional relationships between data, information, knowledge, and wisdom.
 Venn Diagrams
Venn Diagrams are actively used to illustrate simple set relationships in set theory and probability theory, logic and statistics, mathematics and computer science, linguistics, sociology, and marketing. Venn Diagrams are also often used to visually summarize the status and future viability of a project.
Venn Diagram Examples for Problem Solving. Computer Science. Chomsky Hierarchy
A Venn diagram, sometimes referred to as a set diagram, is a diagramming style used to show all the possible logical relations between a finite amount of sets. In mathematical terms, a set is a collection of distinct objects gathered together into a group, which can then itself be termed as a single object. Venn diagrams represent these objects on a page as circles or ellipses, and their placement in relation to each other describes the relationships between them. The Venn diagram example below visualizes the the class of language inclusions described by the Chomsky hierarchy.- Sales Funnel Icon Png
- Icon Job Disk Png
- Sales Rep Icon Png
- Ordar Vector Png
- Sales Order Icon Png
- Sales workflow - Vector stencils library | Pyramid Diagram | Pyramid ...
- Sale Vector Png
- Symbol Of Direct Mail Png
- Sales workflow - Vector stencils library | Currency - Vector stencils ...
- Sales workflow - Vector stencils library | Sales workflow - Vector ...
- Cart Sales Colorful Png
- Sales Profile Icon
- Design elements - Sales workflow | Sales workflow - Vector stencils ...
- Visa Card Icon Png
- Payment Vector Png
- Social Media Response | LDAP - Vector stencils library | Chemistry ...
- Entity-Relationship Diagram (ERD) | Sales workflow - Vector stencils ...
- Process Flowchart | DroidDia prime | Sales symbols - Vector stencils ...
- Invoice Png
- Registration Icon Vector Png
