HR Management Software
Human resource management (HRM) is a professional discipline which oversees and manages an organization's human resources, and aspires maximize employee performance for an employer's strategic objectives. The HR Management Software is an incredibly powerful tool for those who need to analyze or present human resource process flows in a visually effective manner.TQM Software — Build Professional TQM Diagrams
The Total Quality Management Diagram solution helps you and your organization visualize business and industrial processes. Create Total Quality Management diagrams for business process with ConceptDraw software.HR Flowchart Symbols
Human resources are the people who make up the employee workforce of an organization or company. Human resource management has four basic functions: staffing, motivation, training and development, and maintenance. It is convenient to use the flowcharts to represent various HR processes and workflows. ConceptDraw DIAGRAM diagramming and vector drawing software extended with HR Flowcharts solution from the Management area of ConceptDraw Solution Park supplies you with comprehensive selection of predesigned vector HR flowchart symbols and standardized flowchart notation symbols, which allow you to design effectively the eye-catching infographics and diagrams relating to any human resource management process that will be relevant and understood by all business associates. The ConceptDraw DIAGRAM software offers also the set of predesigned flowchart and workflow templates and samples making your drawing process as easy as possible. Use the HR Flowcharts solution to create professional-looking HR Flowcharts and HRM Business Process Diagrams in a matter of moments.Human Resource Management
ConceptDraw DIAGRAM diagramming and vector drawing software enhanced with powerful HR Flowcharts Solution from the Management Area of ConceptDraw Solution Park perfectly suits for Human Resource Management.Fishbone Diagram Problem Solving
The Ishikawa diagram, Cause and Effect diagram, Fishbone diagram — all they are the names of one and the same visual method for working with causal connections. Originally invented by Kaoru Ishikawa to control the process quality, the Ishikawa diagram is well proven in other fields of management and personal scheduling, events planning, time management. It is a chart in the form of a fish, whose head is a problem, the fins are variants for its causes. To design easily the Fishbone diagram, you can use a special ConceptDraw DIAGRAM ector graphic and diagramming software which contains the powerful tools for Fishbone diagram problem solving offered by Fishbone Diagrams solution for the Management area of ConceptDraw Solution Park.Flowchart Software
Flowchart is a simple diagram, map or graphical schematic representation the sequence of actions within a process. It is ideal for displaying how a process currently flows or can function ideally. The Flowcharts let define the steps and boundaries of a process, uncover problems or miscommunications. The Flowcharts are widely used in education, software development, business, economics, thanks to their visuality they are ideal for presentations, reports, for using on conferences to help the audience comprehend the content better, or easy find flaws in a process flow diagrams. ConceptDraw DIAGRAM is professional flowcharts software and feature-rich flowchart maker, which supports Mac OS X and Windows. It contains at ConceptDraw Solution Park a rich set of stencils and professional flowchart symbols for design. It lets create simply professional-looking Flowcharts based on thousand free flowchart templates, colored symbols and examples. ConceptDraw DIAGRAM is a 3 times cheaper alternative to MS Visio available for both Mac and PC. It’s is another full featured business and technical diagramming application that can easily take care of Visio files within OS X. Another bonus with ConceptDraw DIAGRAM – it's cross-platform. You can work on a document in both OS X and Windows, skipping Visio entirely.
Selecting & Creating Flowcharts
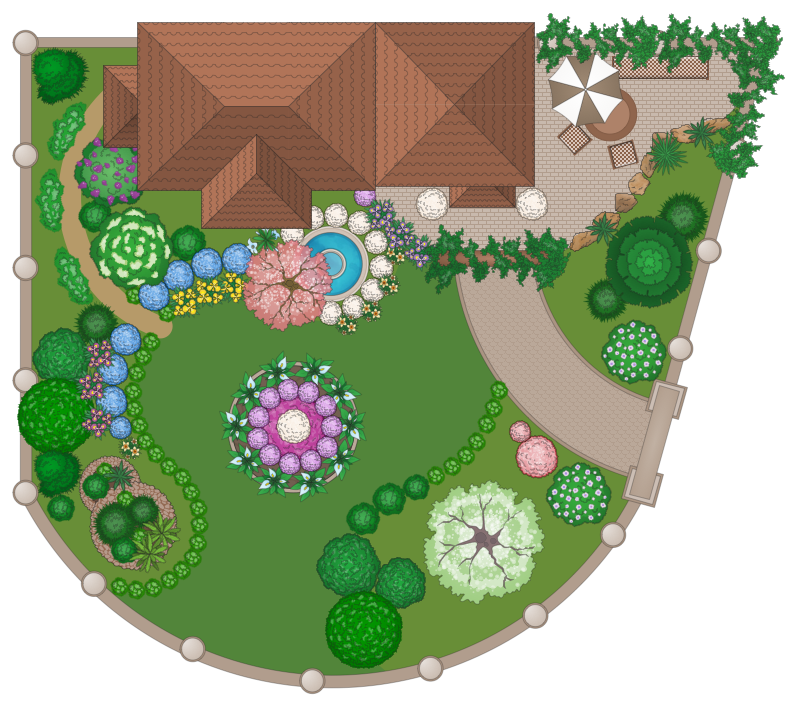
ConceptDraw Flowcharts visualize a process or algorithm of program as step/operation blocks of various shapes connected with arrowed lines showed the process flow direction. They are used to visualize business or technical processes and software algorithms.Landscape Plan
A landscape plan depicts all the features of a future garden including buildings, plants, lawns or a patio. Such plan is a very important part of site adjustment because it gives a complete picture of future project.- What Is The Objective Of Hrm Digram
- Diagram Of An Hrm Function
- Hrm Model Diagram
- Objective Of Hrm Digrm
- Diagram Function Of HRM
- Hrm Diagram Model
- HR Management Software | Human Resource Management ...
- Diagram Of Objectives Of Tqm
- Hrm Chart
- Strategy Hrm Flow Diagram
- Software for Creating SWOT Analysis Diagrams | TQM Software ...
- Hrm Planning Diagram Hrm
- Structure Of Hrm With Diagram
- Hr Management Flow Chart
- Hrm Diagram Representation
- Hrm Process Model
- Interrelationship Between Objective And Process Diagram
- Fishbone Diagram Problem Solving | Using Fishbone Diagrams for ...
- Easy Functions Of Hrm With Diagram


