 Fault Tree Analysis Diagrams
This solution extends ConceptDraw PRO v9.5 or later with templates, fault tree analysis example, samples and a library of vector design elements for drawing FTA diagrams (or negative analytical trees), cause and effect diagrams and fault tree diagrams.
Fault Tree Analysis Software

HelpDesk
How to Create a Fault Tree Analysis Diagram (FTD) in ConceptDraw PRO

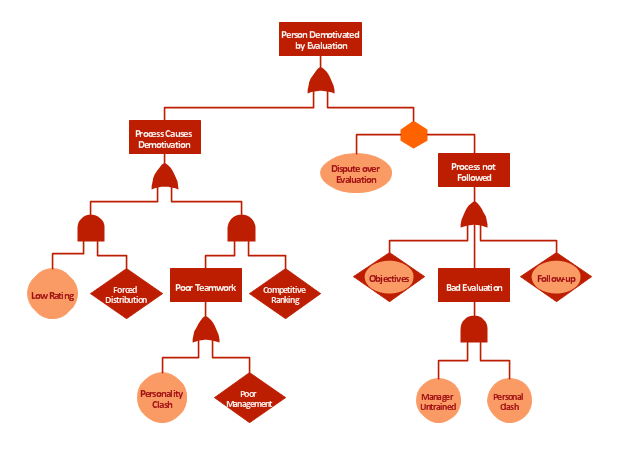
"Subjective performance evaluation allows the use of a subtler, more balanced assessment of employee performance, and is typically used for more complex jobs where comprehensive objective measures are difficult to specify and/ or measure. Whilst often the only feasible method, the attendant problems with subjective performance evaluation have resulted in a variety of incentive structures and supervisory schemes. One problem, for example, is that supervisors may under-report performance in order to save on wages, if they are in some way residual claimants, or perhaps rewarded on the basis of cost savings. This tendency is of course to some extent offset by the danger of retaliation and/ or demotivation of the employee, if the supervisor is responsible for that employee’s output. ...
Another problem relates to what is known as the "compression of ratings". Two related influences—centrality bias, and leniency bias—have been documented ... The former results from supervisors being reluctant to distinguish critically between workers (perhaps for fear of destroying team spirit), while the latter derives from supervisors being averse to offering poor ratings to subordinates, especially where these ratings are used to determine pay, not least because bad evaluations may be demotivating rather than motivating. However, these biases introduce noise into the relationship between pay and effort, reducing the incentive effect of performance-related pay. ... this is the reason for the common separation of evaluations and pay, with evaluations primarily used to allocate training.
Finally, while the problem of compression of ratings originates on the supervisor-side, related effects occur when workers actively attempt to influence the appraisals supervisors give, either by influencing the performance information going to the supervisor: multitasking (focussing on the more visibly productive activities...), or by working “too hard” to signal worker quality or create a good impression...; or by influencing the evaluation of it, e.g., by "currying influence"... or by outright bribery..." [Principal–agent problem. Wikipedia]
The example "Person demotivated by evaluation - Fault tree analysis diagram" was created using the ConceptDraw PRO diagramming and vector drawing software extended with the Fault Tree Analysis Diagrams solution from the Engineering area of ConceptDraw Solution Park.
FTA diagram
Root Cause Tree Diagram

Process Flowchart


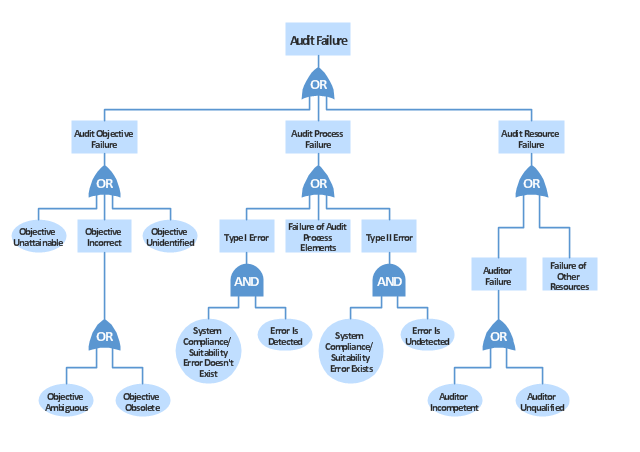
"Failure analysis is the process of collecting and analyzing data to determine the cause of a failure. It is an important discipline in many branches of manufacturing industry, such as the electronics industry, where it is a vital tool used in the development of new products and for the improvement of existing products. There are many companies which provide services to find the cause of failure in products, devices and in post disaster situations. The failure analysis process relies on collecting failed components for subsequent examination of the cause or causes of failure using a wide array of methods, especially microscopy and spectroscopy. The NDT or nondestructive testing methods (such as Industrial computed tomography scanning) are valuable because the failed products are unaffected by analysis, so inspection always starts using these methods." [Failure analysis. Wikipedia]
The example "Audit failure - Fault tree analysis diagram" was created using the ConceptDraw PRO diagramming and vector drawing software extended with the Fault Tree Analysis Diagrams solution from the Engineering area of ConceptDraw Solution Park.
The example "Audit failure - Fault tree analysis diagram" was created using the ConceptDraw PRO diagramming and vector drawing software extended with the Fault Tree Analysis Diagrams solution from the Engineering area of ConceptDraw Solution Park.
FTA diagram
Graphics Software for Business
 diagram")
, t chart, decision matrix, decision tree analysis") Decision Making
Decision Making
The Decision Making solution offers the set of professionally developed examples, powerful drawing tools and a wide range of libraries with specific ready-made vector decision icons, decision pictograms, decision flowchart elements, decision tree icons, decision signs arrows, and callouts, allowing the decision maker (even without drawing and design skills) to easily construct Decision diagrams, Business decision maps, Decision flowcharts, Decision trees, Decision matrix, T Chart, Influence diagrams, which are powerful in questions of decision making, holding decision tree analysis and Analytic Hierarchy Process (AHP), visual decomposition the decision problem into hierarchy of easily comprehensible sub-problems and solving them without any efforts.
7 Management & Planning Tools

- Example Of Problem Tree And Objective Tree Tree Diagrams Pdf
- Block Diagram Of Management By Objectives
- PROBLEM ANALYSIS . Root Cause Analysis Tree Diagram | Root ...
- FTA diagram - Hazard analysis | Accident analytic tree - FTA ...
- Objective Of Audit With Diagram
- Fault Tree Analysis Diagrams | Root cause analysis tree diagram ...
- Root cause analysis tree diagram - Template | Fault Tree Diagram ...
- Fault Tree Analysis Examples And Solutions
- SWOT Analysis | Human Resource Development | Fault Tree ...
- Fault Tree Analysis Template