This site uses cookies. By continuing to browse the ConceptDraw site you are agreeing to our Use of Site Cookies.

Flow Chart Symbols

The Flowcharts are incredibly useful and popular tool used in science, business, software development, analytics, engineering, marketing, manufacturing, administration, architecture, government, politics, and many other fields thanks to a variety of existing types of flowcharts. A Flowchart is a visual graphical representation of the process, algorithm, or the set of steps taken for problem's solution. Widely used for designing, visualizing and documenting simple and complex processes and programs, they effectively help to understand the process and to find easier the flaws if they are. Each flowchart type supposes the use of its own set of notations for drawing corresponding diagram, which includes the symbols of process, decision, data, document, data base, termination, initiation processes, processing loops, conditions, etc. It is easily design a Flowchart using the special professional flowchart maker - ConceptDraw DIAGRAM diagram software with numerous predesigned flow chart symbols grouped in libraries of Flowcharts solution from ConceptDraw Solution Park.

How to Build a Flowchart

The ConceptDraw DIAGRAM is a professional software for quick creating great looking flowcharts. The vector stencils from object libraries allows you to use RapidDraw technology. By the clicking on direction arrows one can add new object to flowcharts. This technology gives to users the ability to fast creating visualization for the structural data. Learn the basics of flowcharting and see how to build create a flowchart using ConceptDraw automatic drawing tools.

Flowchart Programming Project. Flowchart Examples

Create you own flow charts of process-driven software applications using the ConceptDraw DIAGRAM diagramming and vector drawing software extended with the Cross-Functional Flowcharts solution from the Business Processes area of ConceptDraw Solution Park. The programming project flow chart example shows the logical process of execution.

How to Dramatically Reduce Drawing Time - New connection modes

The innovative ConceptDraw Arrows10 Technology included in ConceptDraw DIAGRAM is a powerful drawing tool that changes the way diagrams are produced. While making the drawing process easier and faster. This is more than enough versatility to draw any type of diagram with any degree of complexity.

Cross-Functional Flowchart (Swim Lanes)

Cross-Functional Flowchart is a type of chart which shows the series of process steps connected by the arrows to depict their order and applies the swim lanes to provide an extra dimension with means of assigning each process step to certain category. Often the category or the functional unit is a stakeholder (department, person, role), resource, project, phase, or any other attribute. Cross-Functional Flowcharts visually illustrate relationships between the business processes and the functional units responsible for this processes. ConceptDraw DIAGRAM is a powerful diagramming and vector drawing software for professional design Cross-Functional Flowcharts using the common notation of shapes and swim lanes. Cross-Functional Flowcharts solution included to the Business Processes area of ConceptDraw Solution Park provides numerous well-designed vector objects and connector tools for quick, easy and effective organizing information, representing process flows and relationships, and drawing Cross-Functional Flowcharts for business, science, education, technology, etc.
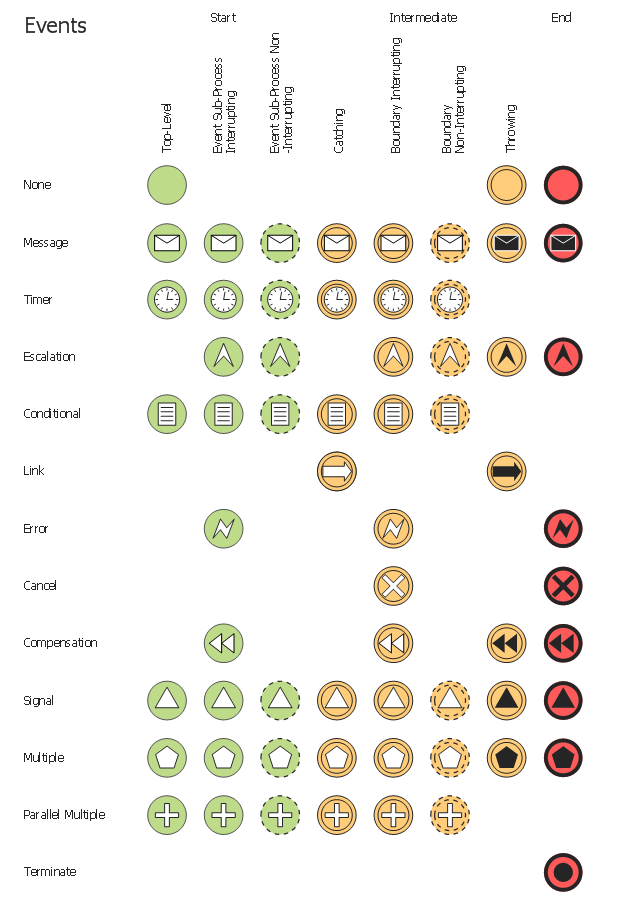
The vector stencils library "Events" contains 17 symbols: start, intermediate and end events and none events, message, timer, error, escalation, cancel, compensation, conditional, link, signal, terminate, multiple and parralel multiple events, off-page connectors (catching and throwing).
Use these shapes for drawing business process diagrams (BPMN 2.0) using the ConceptDraw PRO diagramming and vector drawing software.
An Event is something that happens during the course of a business process. These events affect the flow of the process and usually have a cause or an impact. There are three types of Events, based on when they affect the flow: Start, Intermediate and End.
The example "Design elements - Events BPMN 2.0" is included in the Business Process Diagram solution from the Business Processes area of ConceptDraw Solution Park.
BPMN 2.0 event symbols
BPMN 2.0 event symbols , timer, terminate, signal, parallel multiple event, off-page connector, catching, none, start, none, intermediate, none, end, multiple event, message, link, escalation, error, conditional, compensation, cancel, Off-page connector, throwing,

Swim Lane Flowchart Symbols

Use the set of special professionally developed swim lane flowchart symbols - single, multiple, vertical and horizontal lanes from the Swimlanes and Swimlanes BPMN 1.2 libraries from the Business Process Diagram solution, the Swim Lanes library from the Business Process Mapping solution as the perfect basis for your Swim Lane Flowcharts of processes, algorithms and procedures.

ConceptDraw Arrows10 Technology

Auto-connection mode - This is more than enough versatility to draw any type of diagram with any degree of complexity. How should diagramming software work? Is it possible to develop a diagram as quickly as the ideas come to you? The innovative Auto-connection mode is what you need to start draw.

MS Visio Look a Like Diagrams

No need for any special drawing skills to create professional looking diagrams outside of your knowledge base. ConceptDraw DIAGRAM takes care of the technical details, allowing you to focus on your job, not the drawing. ConceptDraw DIAGRAM delivers full-functioned alternative to MS Visio. ConceptDraw DIAGRAM supports import of Visio files. ConceptDraw DIAGRAM supports flowcharting, swimlane, orgchart, project chart, mind map, decision tree, cause and effect, charts and graphs, and many other diagram types.

Flowchart design. Flowchart symbols, shapes, stencils and icons

A flowchart is a type of diagram which represents an algorithm, process or workflow, displays the steps as boxes of various kinds and depicts their order by connecting them with arrows. Any business graphic document will be more colorful and understandable if will use professional-looking and visual diagrams and flowcharts. Flowchart design gives versatile presenting and explaining of the process. ConceptDraw DIAGRAM flowchart software enhanced with Flowcharts solution helps effectively make Flowchart Design. Use of predesigned flowchart symbols and bright color palette offers a fresh view and favorably distinguishes the flowcharts designed in ConceptDraw DIAGRAM from the black and white flowcharts on a paper. Preferably to use no more than three or four colors and apply identical for the same shape types. The best flowchart design can be achieved by starting with Flowchart template, or any of suitable ready examples or samples offered in ConceptDraw STORE, open one of them and enter the proper text into each Flowchart shape. Each symbol of the flowchart has a definition that can't be changed. This means that all flowcharts shapes can be grouped in according to their meaning. Users with ConceptDraw DIAGRAM flowchart software can style groups of symbols with close definitions by color sets chosen from complementary palette. Almost all workflows can be depicted as a flowchart. Colored diagrams are more light for perception of the certain information, this is part of flowchart design. Bright colors need to be used in the key points of Decision symbols, to focus attention on their importance for whole process flow.
Business Process Modeling with ConceptDraw
Business Process Modeling with ConceptDraw "Business Process Diagrams" Solution

cross-functional flowchart template, flowchart, example business process flow Cross-Functional Flowcharts

cross-functional flowchart template, flowchart, example business process flow
Cross-functional flowcharts are powerful and useful tool for visualizing and analyzing complex business processes which requires involvement of multiple people, teams or even departments. They let clearly represent a sequence of the process steps, the order of operations, relationships between processes and responsible functional units (such as departments or positions).

Electrical Symbols — Resistors

A resistor is a passive two-terminal electrical component that implements electrical resistance as a circuit element. Resistors may be used to reduce current flow, and, at the same time, may act to lower voltage levels within circuits. In electronic circuits, resistors are used to limit current flow, to adjust signal levels, bias active elements, and terminate transmission lines among other uses. Fixed resistors have resistances that only change slightly with temperature, time or operating voltage. Variable resistors can be used to adjust circuit elements (such as a volume control or a lamp dimmer), or as sensing devices for heat, light, humidity, force, or chemical activity. 26 libraries of the Electrical Engineering Solution of ConceptDraw DIAGRAM make your electrical diagramming simple, efficient, and effective. You can simply and quickly drop the ready-to-use objects from libraries into your document to create the electrical diagram.

flow chart software, flowchart maker, flowchart, flow chart Flowcharts

flow chart software, flowchart maker, flowchart, flow chart
The Flowcharts solution for ConceptDraw DIAGRAM is a comprehensive set of examples and samples in several varied color themes for professionals that need to represent graphically a process. Solution value is added by the basic flow chart template and shapes' libraries of flowchart notation. ConceptDraw DIAGRAM flow chart creator lets one depict the processes of any complexity and length, as well as design the Flowchart either vertically or horizontally.

Business Process Flowchart Symbols

Business process modeling is known in the corporate world as an excellent tool which can speak. Business process flowcharts, diagrams and maps are used to define the business processes in terms of inputs and outputs, to visually represent and effectively explain complex business processes of an enterprise, and also showcase decisions on a single piece of paper. The process of business process mapping supposes the use of special business process flowchart symbols predefined by Business Process Modeling Notation (BPMN) and taking their roots from the data processing diagrams and programming flow charts. In other words the BPMN standard notation is a common language used for business process design and implementation, that guarantees a clarity of designed Business Process Flowcharts for all business analysts, technical developers and business managers. The ability to create professionally-looking Business Process flowcharts, maps and diagrams, is provided by powerful ConceptDraw DIAGRAM software and the Business Process Mapping solution included to ConceptDraw Solution Park.

Create a Flow Chart

Users can start drawing their own flowchart diagrams in fast and simple way with ConceptDraw software.

process mapping, sipoc diagram, swim lanes, business mapping software, business process map Business Process Mapping

process mapping, sipoc diagram, swim lanes, business mapping software, business process map
The Business Process Mapping solution for ConceptDraw DIAGRAM is for users involved in process mapping and creating SIPOC diagrams.

Swim Lane Diagrams

Swim Lane Diagrams are the kind of process flow diagrams and effective tool for documenting the business processes required for any business company for its productive work, for easy defining the weak points, reasons of defects, or delays during the process. Swim Lane Diagram is based on the IDEF3 standard and was developed primarily for using in projecting. Its name derives from the use of horizontal or vertical lanes. The blocks that denote the parts of the processes are arranged within definite lanes according to the belonging to responsible worker. So the process of any complexity is visually divided into the parts and represented with indication the responsibility for execution of each part. This significantly facilitates the comprehension of its work. Use the ConceptDraw DIAGRAM software and predesigned vector objects from the Swim Lanes library of Business Process Mapping Solution included to ConceptDraw Solution Park to easy develop Swim Lanes Flowcharts and Diagrams, for modeling and documenting the business processes in a simple and visual graphic form.

flowchart maker, data flow diagram, swimlane diagram, business process modeling, how to create a flowchart Classic Business Process Modeling

flowchart maker, data flow diagram, swimlane diagram, business process modeling, how to create a flowchart
The ConceptDraw DIAGRAM software enhanced with Classic Business Process Modeling solution is a powerful flowchart maker and professional business process modeling software with extensive choice of drawing tools, libraries with wide variety of ready-to-use vector objects that are more than sufficient for modeling the business processes and for instant creation variety of diagram types: Control Flow Diagram, Swimlane Diagram, Business Process Modeling Diagram, Functional Flow Block Diagram, Data Flow Diagram. It is ideal for business analysts, developers, as well as for managers and regular users. The samples included to Classic Business Process Modeling solution allow to uncover the solution’s power and to answer qualitatively on how to create a flowchart or to model the business processes with help of diagrams and schemes.

process flow diagram, process flow chart Process Flowcharts

process flow diagram, process flow chart
This solution extends ConceptDraw DIAGRAM software with templates, samples, and library of vector shapes for drawing the Process Flowcharts.